Download
1 / 27
270 likes | 439 Vues
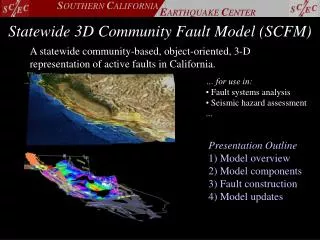
Statewide 3D Community Fault Model (SCFM). A statewide community-based, object-oriented, 3-D representation of active faults in California. … for use in: • Fault systems analysis • Seismic hazard assessment. Presentation Outline 1) Model overview 2) Model components 3) Fault construction

E N D
Statewide 3D Community Fault Model (SCFM) A statewide community-based, object-oriented, 3-D representation of active faults in California. … for use in: • Fault systems analysis • Seismic hazard assessment ... Presentation Outline 1) Model overview 2) Model components 3) Fault construction 4) Model updates
SCFM Overview • consists of SoCal and NoCal CFMs • community models • Includes alternative representations • > 270 faults represented • variable detail • consistent base of model (base of seismicity) •Distributed through website: http://structure.harvard.edu/cfm/ • derived models: CFM-R, trace maps
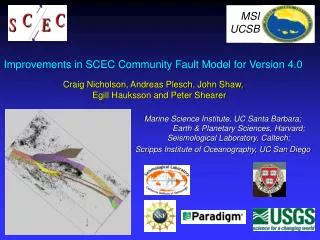
SCEC Community Fault Model, NoCal • Version 1.5 available • > 110 faults represented • Includes alternative representations • iterated through workshop •available for review via SCEC-VDO
SCEC Community Fault Model, SoCal • Version 4.0 preview available • > 150 faults represented • Includes alternative representations •Virtual Workshop evaluated model & ranked alternative fault representations (via LA3D) • Widely used in fault system, strong ground motion, & seismic hazards studies in SCEC. •
CFM components and architecture Triangulated surface fault representations • flexible representation • simple ASCII format Regional topographic surface • USGS DEM (1:250,000 – 60m) SoCal • SRTM DEM (90m) NoCal Seismogenic thickness surface • Nazareth & Hauksson (2004) SoCal • based on Waldhauser (2009) DD catalog NoCal
Generating fault surfaces Seismic profiles (1), wells (2), geologic data (3), and cross sections (4) are assembled and geo-referenced, as well as hypocenters (5) and focal mechanism (5). Fault surfaces are interpolated (a) and extrapolated (b) to define CFM representations. Extrapolated extents can be classified as connectors. Fault surfaces are extrapolated Plesch et al., 2005
Generating fault surfaces, from a trace and a dip estimate A trace is digitized from a geo-referenced map or assembled from Qfaults and projected to the topographic/bathymetric level. A length (eg. 2000m) filtered trace is shifted along the dip to a first depth level (eg. 3km), and a coarser trace to a deep level (eg. 10km). All traces are then connected to a continuous fault surface. Digitized trace filtered trace filtered trace View from below
Alternatives represent substantially different geometric definitions of a fault surface Different styles of fault interaction at depth … Varying degrees of detail … Whittier & Chino faults Alternative 1 Alternative 2 Newport-Inglewood fault
Each version of CFM represents a set of specific alternative representations for each fault Unique fault name and number preferred Alternative 1 Alternative 2 … Interpolated 1 Interpolated 1 Alt. 1 Alt. 2 Ext. 1 Interpolated 2 Interpolated 2 N Ext. 1 Extrapolated 1 Extrapolated 1 Ext. 2 Extrapolated 2 Ext. 3 …
CFM Fault Attributes In the database, each alternative representation will have a unique set of attributes assigned to it, including: • fault type (rl or ll strike-slip, thrust, normal, oblique …) • surface or blind designation, connector • average spatial uncertainty • qualitative assessment of representation (1-5) • slip rate range (CGS/SCFAD) • primary reference list • date generated The database can be queried using these attributes.
Model updates Southern San Andreas: - seismicity based updates - compliance with Qfaults improved Borderlands: - alternative representations of thrusts which allow for all modes of interaction with strike-slip faults.
Model updates in progress Revision of naming and numbering system: • hierarchical: Peninsular Ranges – San Jacinto fault – San Bernardino section – San Jacinto-Claremont fault – vertical • meaningful numbers: two digits for each level • reflects system behaviour
Model updates, UCERF3 relevance Southern San Andreas: - additional sources Blind Palm Springs fault North Palm Springs fault Mecca Hills - Hidden Springs fault - modified sources that allow multiple paths for SAF rupture Banning Garnet Hill San Gorgonio Pass Mission Creek Borderlands: - discussed in dedicated presentation
Regional overview SF Bay area
Regional overview S. Coast Ranges/S Joaquin Valley
Regional overview S. Coast Ranges/S Joaquin Valley
Regional overview Sierra Nevada/Mammoth/Long Valley
Regional overview Sierra Nevada/Mammoth/Long Valley
Regional overview N. Coast Ranges/Sacramento Valley
Regional overview N. Coast Ranges/Sacramento Valley
Regional overview Cascadia/Klamath Mountains/Modoc
Regional overview Cascadia/Klamath Mountains/Modoc
Seismogenic thickness surface for NoCal • Nazareth & Hauksson (2004) use the depth where 99.9% of the total moment in a vertical column was released • Steps: • Selection of events • Gridding and computation • Filtering of low quality cells • Smooth interpolation
Seismogenic thickness surface for NoCal • Central Valley has little seismicity in some places. • Mask nodes in depth surface which are more than 30 km away from closest grid point used in interpolation.
Generating fault surfaces, from the USGS Bay area model and Qfaults Qfault trace Bay area model fault is extracted and compared to Qfault representation. The top of the fault is adjusted to conform to topography, and its length adjusted to conform to Qfaults. Hayward representation in Bay area model Rogers Creek representation in SCFM Qfault trace Calaveras representation in SCFM Hayward representation in SCFM