Download
1 / 23
230 likes | 321 Vues
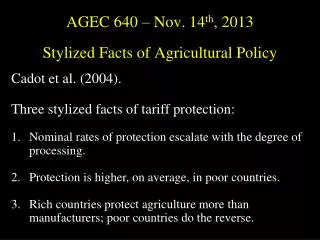
Cadot et al. (2004). Three stylized facts of tariff protection: Nominal rates of protection escalate with the degree of processing. Protection is higher, on average, in poor countries. Rich countries protect agriculture more than manufacturers; poor countries do the reverse.

E N D
Cadot et al. (2004). Three stylized facts of tariff protection: Nominal rates of protection escalate with the degree of processing. Protection is higher, on average, in poor countries. Rich countries protect agriculture more than manufacturers; poor countries do the reverse. AGEC 640 – Nov. 14th, 2013Stylized Facts of Agricultural Policy
Empirical political economy models of agricultural policy • Anderson (1995): “calibrated” CGE model • derives equations for comparative statics, and • computes results using representative numbers. • Cadot et al. (2004): stylized “endogenous tariffs” • structural model for simulations • compare outcomes to observed patterns • Masters and Garcia (2009): econometric tests • specifies implications of various explanations • estimates their magnitude and significance
Anderson’s 1995 EDCC model Anderson begins with the following motivation: “Why is it that price and trade policies in poor countries typically protect the infant industrial sector at the expense of agriculture, while the policy regime in rich countries typically favors farmers relative to industrialists? This pattern seems paradoxical, since the distribution of aggregate votes and wealth has the opposite sectoral bias.” (paragraph 1) and he concludes that: “a distortion of the agricultural/industrial product price ratio has vastly different effects on the real incomes of different groups in rich as compared with poor countries. Indeed, those differences are so large that it seems hardly necessary to consider the relative costs of collective action by different groups as an explanation of policy choices.” (paragraph 4)
Cadot et al. “Until recently, analysts explained these patterns of protection largely by calling on the theory of second best…In poor countries high trade taxes (including taxation of agriculture) are justified by the revenue constraint that because of weak fiscal administration cannot be met by less distortionary instruments. In turn, protection of manufacturing has been justified on infant-industry grounds.” (paragraph 2) “While recognizing the validity of these considerations…an equally if not more important reason for the observed pattern of protection is rooted in…political economy considerations…Governments are not passive executors of a trade policy to maximize social welfare but agents interacting with organized interest groups to maximize an objective function in which social welfare is just one argument.” (paragraph 3)
Progression of research: 1995 Anderson was the first to quantitatively investigate the tariff-protection pattern of agriculture relative to industry in poor and rich countries. Using a “stylized” Ricardo-Viner trade model (AKA a specific-factor model) he showed that support to farmers in rich countries raises their incomes substantially, and reduces manufacturing incomes only slightly. The conclusion, based on an informal argument and stylized results is this: lobbying efforts are likely to pursue concentrated gains, and ignore diffuse losses. The question of “Why?” is still not well developed…
Progression of research: 2004 Cadot et al. use a “Grossman-Helpman” (growth via innovation) political game model in which lobbies “bid for protection” (with $$$, i.e. “protection for sale”) and the government maximizes a weighted average of social welfare and contributions. Lobbies are owners of sector-specific capital (as in the Ricardo-Viner model). Innovation: capital is concentrated (i.e. selfish) and labor is mobile. Wage rate is not fixed, so “counter-lobbying” may take place (e.g. by organized labor). Protection arises “endogenously” in a way that is consistent with the empirical patterns observed.
Progression of research: 2009 Finally, Masters and Garcia approach the issue econometrically. Using data on observed features of economies and observed rates of protection, they lay out a series of competing hypotheses regarding the motivations for policy, and then ask whether the observed data support or refute the hypotheses. Their innovation is partly that they begin to address the question of WHY the observed patterns might exist.
Structure and implications of Anderson’s political economy model Start with a model in “free-trade equilibrium”… then introduce a budget-neutral “tax-with-subsidy” (a tax-cum-subsidy is simply a policy that introduces either a tax or a subsidy to achieve some stated outcome) The policy generates concentrated gains and diffuse losses: • if it favors industry in poor countries, (industry gains, farmers lose) and • if it favors agriculture in rich countries (farmers gain, industry loses)
Anderson’s model: three sectors, in two kinds of countries (Agric.) (Manuf.) (Serv.) (Agric.) (Manuf.) (Serv.) Why is this important?
Anderson’s results: elasticities of response Compare the payoffs to capital in each sector elast. w.r.t. production subsidy (not trade policy) elast. w.r.t. food consumption subsidy for nonfarmers
In Cadot et al.’s model… Lobbies representing all sectors (indexed by j) bid simultaneously for protection.The “contribution” is a function of domestic price: i.e. C(p) Where W(p) is social welfare and a is a weight that the government attaches to social welfare.
Cadot et al.’s results (part 1)… More protection of ag in the rich countryMore protection of manuf. in the poor countryWhy? Follow the specific capital…
Cadot et al.’s results (part 2)… With greater weight on consumers, there is less protection. Any surprise?
Testing political economy modelsusing the Anderson et al. data • A 3-year project at the World Bank involving 100+ researchers and case studies for 68 countries, 77 commodities over 40+ years • Project results published in six books • Four volumes of country narratives • Africa (Anderson & Masters); Asia (Anderson & Martin); LAC (Anderson & Valdes); European Transition (Anderson & Swinnen) • Two global volumes • One with regional syntheses and reform simulations • One with political economy explanations for policy choices • Results today and next week are mostly from W.A. Masters and A. Garcia (2009), “Agricultural Price Distortion and Stabilization: Stylized Facts and Hypothesis Tests,” in K. Anderson, ed., Political Economy of Distortions to Agricultural Incentives. Washington, DC: World Bank. • All available at www.worldbank.org/agdistortions
- P P dom free º NRA P free The method: price distortions from “stroke of the pen” policies • Tariff-equivalent Nominal Rate of Assistance in domestic prices relative to free trade: • Sometimes estimated directly from observed policy: • More often imputed by price comparison: • They also introduce a new “stabilization index”, for the standard deviations around trend prices:
Explaining the data The overall approach is to test for: • stylized facts • persistent correlations with broadly-defined variables, that could result from many different policymaking mechanisms • specific political-economy mechanisms • other correlations with narrowly-defined variables, as implied by particular theories of policymaking • these could explain residuals and add explanatory power to the stylized facts, or explain the stylized facts themselves • most tests are weak; only in one case do the authors have a strong identification strategy
The three stylized facts The three broad influences that are captured are: • A development paradox from taxation to subsidies as incomes rise, as measured by real GDP per capita at PPP prices • An anti-trade bias from taxation of both imports and exports, as measured by whether commodity is importable or exportable in each year • A resource curse effect from taxation of natural resources, as measured by arable land area per capita (FAOSTAT)
Seven specific hypotheses They test for each standard theory of policy failure: • Rational ignorance when per-person effects are small • Free ridership when groups of people are large (versus more political support from larger groups) • Rent-seeking by unconstrained incumbents (versus checks-and-balances from institutions and markets) • Revenue motives for cash-strapped governments • Time consistency of policy when taxation is reversible but investment is not (as opposed to simultaneous choices) • Status-quo bias from loss aversion or conservative social welfare functions in politics • Rent dissipation from the entry of new farmers (as opposed to free riding among existing farmers)