Download
1 / 85
850 likes | 878 Vues
Delve into polygenic traits, multifactorial disease models, and QTL analysis in this informative course workshop. Explore the genetic basis of common diseases and uncover the intricacies of complex trait inheritance. Join our esteemed faculty for an enriching learning experience.

E N D
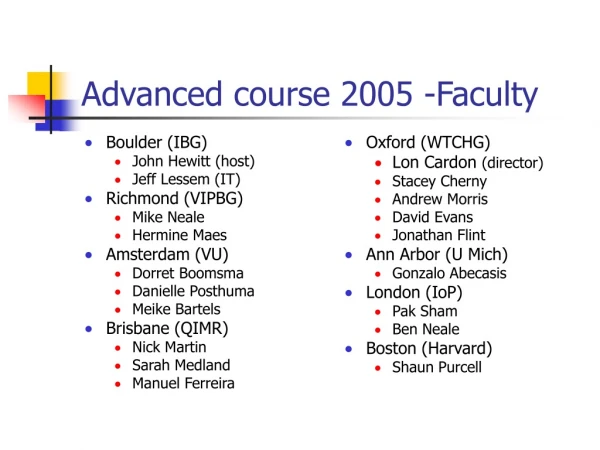
Boulder (IBG) John Hewitt (host) Jeff Lessem (IT) Richmond (VIPBG) Mike Neale Hermine Maes Amsterdam (VU) Dorret Boomsma Danielle Posthuma Meike Bartels Brisbane (QIMR) Nick Martin Sarah Medland Manuel Ferreira Oxford (WTCHG) Lon Cardon (director) Stacey Cherny Andrew Morris David Evans Jonathan Flint Ann Arbor (U Mich) Gonzalo Abecasis London (IoP) Pak Sham Ben Neale Boston (Harvard) Shaun Purcell Advanced course 2005 -Faculty
Hunting QTLs Nick Martin Queensland Institute of Medical Research Boulder workshop: March 7, 2005
1 Gene 3 Genotypes 3 Phenotypes 2 Genes 9 Genotypes 5 Phenotypes 3 Genes 27 Genotypes 7 Phenotypes 4 Genes 81 Genotypes 9 Phenotypes Polygenic Traits
Rationale for QTL analysis • QTL = quantitative trait locus • Biology: Understanding genetic variation by dissecting complex traits • basic biology • applications in agriculture • applications in medicine
Multifactorial Threshold Model of Disease Multiple thresholds Single threshold unaffected affected normal mild mod severe Diseaseliability Disease liability
Common diseases • Estimated life time risk c.60% • Substantial genetic component • “Non-Mendelian” inheritance • Non-genetic risk factors • Multiple interacting pathways • Most genes still not mapped
Examples • Ischaemic heart disease (30-50%, F-M) • Breast cancer (12%, F) • Colorectal cancer (5%) • Recurrent major depression (10%) • ADHD (5%) • Non-insulin dependent diabetes (5%) • Essential hypertension (10-25%)
Complex Trait Model Linkage Marker Gene1 Linkage disequilibrium Mode of inheritance Linkage Association Gene2 Disease Phenotype Individual environment Gene3 Common environment Polygenic background
Even for “simple” diseasesthe number of alleles is large • Ischaemic heart disease (LDR) >190 • Breast cancer (BRAC1) >300 • Colorectal cancer (MLN1) >140
Complex disease: common or rare alleles? [Science 2004]
Definitions • Locus: one of 20-40,000 genes • Allele: Variant of a specific gene • Gene: sequence of DNA that codes for a specific function • Base pair: chemical “letter” of the genome (a gene has many 1000’s of base pairs) • Genome: all the genes considered together
Defining the Haystack • 3x10⁹ base pairs • Markers every 6-10kb for association in populations with no recent bottleneck history • 1 SNPs per 721 b.p. (Wang et al., 1998) • c.14 SNPs / 10kb = 1000s haplotypes/alleles • O (104 -105) genes
Finding QTLs • Linkage • Association
Linkage = Co-segregation A3A4 A1A2 A1A3 A2A4 A2A3 Marker allele A1 cosegregates with dominant disease A1A2 A1A4 A3A4 A3A2
Automated microsatellite genotyping – a major breakthrough (early 90s) MZ and DZ twins: determining zygosity using ABI Profiler™ genotyping (9 STR markers + sex) MZ DZ DZ
Genotype information for Twin Mole and Twin Maps studies (v23_09)
Genotype information for Twin Mole and Twin Maps studies (v23_09)
x 1/4 1/4 1/4 1/4
Sib 1 Sib 2 4/16 = 1/4 sibs share BOTH parental alleles IBD = 2 8/16 = 1/2 sibs share ONE parental allele IBD = 1 4/16 = 1/4 sibs share NO parental alleles IBD = 0 IDENTITY BY DESCENT
For disease traits (affected/unaffected) Affected sib pairs selected 1000 750 500 250 Expected 1 2 3 127 310 IBD = 2 IBD = 1 Markers IBD = 0
1.00 0.75 Correlation between sibs 0.50 0.25 0.00 IBD = 0 IBD = 1 IBD = 2 For continuous measures Unselected sib pairs
rMZ = rDZ = 1 rMZ = 1, rDZ = 0.5 E E ^ rMZ = 1, rDZ = C C e e A A c c a a Q Q q q Twin 1 mole count Twin 2 mole count
Human OCA2 and eye colour Zhu et al., Twin Research 7:197-210 (2004)
Linkage Results for IQ and Reading p-value cM
Increasing power for QTL linkage (1) Multivariate analysis
E G VAR 1 VAR 2 VAR 3 E E G G G E
Effect of multivariate analysis on linkage power Multivariate and univariate linkage analysis of six reading-related measures on chromosome 18 Am. J. Hum. Genet., 72:561-570, 2003 Use of Multivariate Linkage Analysis for Dissection of a Complex Cognitive Trait Angela Marlow, Simon Fisher, Clyde Francks, Laurence MacPhie, Stacey Cherny, Alex Richardson, Joel Talcott, John Stein, Anthony Monaco, and Lon Cardon
Ridge count The size of prints can be measured by counting the number of ridges from the triradii to the core Ridge count can be summed over all fingers to give a total ridge count Diagram from Holt, 1968 Highly heritable: MZ r = .94 CI .89 - .96 DZ r = .42 CI .34 - .50 A .82 CI .56 - .95 D .11 CI .00 - .37 E .07 CI .05 - .10
Univariate Multivariate (Univariate , Multivariate ) TRC vs Multivariate(-LOG10p)
Resulting in a very conservative test Chromosome 1 Similar ‘drop chi-squares’ for pleiotropic QTLs
Chromosome 7 … Evidence of developmental fields?
Increasing power for QTL linkage (2) Selecting extreme pairs
Information Score for Additive Gene Action (p=0.5) 350 300 250 Information score 200 150 100 10 8 6 1 2 3 Sib 2 4 4 5 6 7 2 8 9 10 Decile ranking - Sib 1
Scatterplots of the distribution of neuroticism scores for each sibling pair Distribution of entire sample Distribution of selected sample
Multipoint linkage analysis of the genome for individual variation in neuroticism The -logP values (vertical axis) for the Visscher-Hopper regression are shown. The cumulative distance is given at the bottom, and chromosome numbers are given at the top. The two dotted, horizontal lines represent the empirically derived genome wide significance thresholds (5% and 1%). Am. J. Hum. Genet., 72:000, 2003 Linkage Analysis of Extremely Discordant and Concordant Sibling Pairs Identifies Quantitative-Trait Loci That Influence Variation in the Human Personality Trait Neuroticism Jan Fullerton, Matthew Cubin, Hemant Tiwari, Chenxi Wang, Amarjit Bomhra, Stuart Davidson, Sue Miller, Christopher Fairburn, Guy Goodwin, Michael Neale, Simon Fiddy, Richard Mott, David B. Allison, and Jonathan Flint
Increasing power for QTL linkage (3) Increasing marker density
Information for marker density 0.5, 1, 2, 10cM scan Limits of fine mapping a quantitative trait Attwood LD & Heard-Costa NL. Genetic Epidemiology 24:99-106, 2003