Download

1 / 21
210 likes | 383 Vues
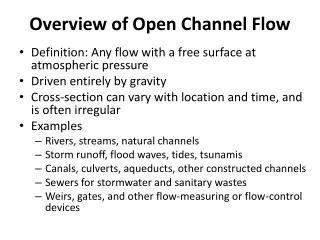
Open Channel Flow in Pipes CE 365K Hydraulic Engineering Design. Reading: “ Stormwater Conveyance..” Sec 7.1, pp. 218-223. “ Modeling Stormwater Sewer Systems using High Resolution Data ”. Hydraulic Engineering Design Carlos Galdeano. Austin, Texas Spring 2014. Introduction and Scope.

E N D
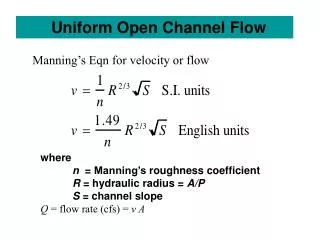
Open Channel Flow in PipesCE 365K Hydraulic Engineering Design Reading: “Stormwater Conveyance..” Sec 7.1, pp. 218-223
“Modeling Stormwater Sewer Systems using High Resolution Data” Hydraulic Engineering Design Carlos Galdeano Austin, Texas Spring 2014
Introduction and ScopeIntroduction • More than 54% of the world population lives in urban areas, and this percentage is projected to increase rapidly in future years. This growth significantly affects the hydrological cycle, which translates into social and economic costs due to urban flooding Carlos Galdeano
Introduction and ScopeScope The main scope is to develop a procedure to evaluate the current storm water infrastructure using Airborne LiDAR data. Airborne LiDAR data provides the elevation data necessary to characterize the elements involved in the storm water system. The stormwater sewer system in northwest area of The University of Texas at Austin main campus is the region analyzed in this project. Carlos Galdeano
Inputs ArcMap MethodologyGeneral Methodology StormCAD Results Airborne LiDAR Data LAS to Multipoint Create a TIN Create LAS Dataset Point File Toolbox Create the Feature Classes of the stormwater sewer system Digitize the stormwater sewer system’s elements Import CAD Files to ArcMap Characterize the elements of the system CAD files of Stormwater Sewer Systems Invert Elevation Ratio of Flow to the Total Capacity at pipeline Austin’s IDF Table Define Headloss coefficient Add Gutters Run Model Import characterized elements to StormCAD StormCAD Catalog Conduit Carlos Galdeano
Inputs ArcMap MethodologyTIN Methodology Airborne LiDAR Data LAS to Multipoint Create a TIN Create LAS Dataset Point File Toolbox Carlos Galdeano
MethodologyTIN Methodology Carlos Galdeano
View of face elevation with graduated color ramp of the TIN View of nodes and edges that form the TIN MethodologyTIN Methodology Carlos Galdeano
Inputs ArcMap MethodologyCharacterizing elements in the stormwater sewer system StormCAD Results Airborne LiDAR Data LAS to Multipoint Create a TIN Create LAS Dataset Point File Toolbox Create the Feature Classes of the stormwater sewer system Digitize the stormwater sewer system’s elements Import CAD Files to ArcMap Characterize the elements of the system CAD files of Stormwater Sewer Systems Invert Elevation Ratio of Flow to the Total Capacity at pipeline Austin’s IDF Table Define Headloss coefficient Add Gutters Run Model Import characterized elements to StormCAD StormCAD Catalog Conduit 11 Carlos Galdeano
Inputs ArcMap MethodologyCharacterizing elements in the stormwater sewer system Create the Feature Classes of the stormwater sewer system Digitize the stormwater sewer system’s elements Import CAD Files to ArcMap Characterize the elements of the system CAD files of Stormwater Sewer Systems Invert Elevation Carlos Galdeano
MethodologyCharacterizing elements in the stormwater sewer system Elements’ characteristics of the Stormwater Sewer System Carlos Galdeano
Inputs ArcMap MethodologyRunning Model in StormCAD StormCAD Results Airborne LiDAR Data LAS to Multipoint Create a TIN Create LAS Dataset Point File Toolbox Create the Feature Classes of the stormwater sewer system Digitize the stormwater sewer system’s elements Import CAD Files to ArcMap Characterize the elements of the system CAD files of Stormwater Sewer Systems Invert Elevation Ratio of Flow to the Total Capacity at pipeline Austin’s IDF Table Define Headloss coefficient Add Gutters Run Model Import characterized elements to StormCAD StormCAD Catalog Conduit Carlos Galdeano
Inputs StormCAD MethodologyRunning Model in StormCAD Add gutters for those inlets that are On Grade. Since they don’t capture all the water that flows over them, a gutter has to be drawn to connect the Inlet On Grade to the next Inlet. This will help to indicate where the water that was not captured will end. Inlets at the end of the line are defined by the standard method with a headloss coefficient of 1.25 Inlets in the middle of the line, manholes, and joints are defined by the HEC-22 Energy method with a flat HEC-22 benching method. Austin’s IDF Table Define Headloss coefficient Add Gutters Run Model Import characterized elements to StormCAD StormCAD Catalog Conduit Carlos Galdeano
Inputs ArcMap MethodologyGenerating Results StormCAD Results Airborne LiDAR Data LAS to Multipoint Create a TIN Create LAS Dataset Point File Toolbox Create the Feature Classes of the stormwater sewer system Digitize the stormwater sewer system’s elements Import CAD Files to ArcMap Characterize the elements of the system CAD files of Stormwater Sewer Systems Invert Elevation Results and Conclusions Austin’s IDF Table Define Headloss coefficient Add Gutters Run Model Import characterized elements to StormCAD StormCAD Catalog Conduit Carlos Galdeano
Results Ratio of Flow to the Total Capacity for each pipeline
Results Location of Max Values Pipeline at intersection of Dean Keaton and Speedway Pipeline at intersection of Dean Keaton and footbridge Max value 2-yr storm event = 33.80% Max value for: 10-yr storm event = 52.90% 25-yr storm event = 63.50% 100-yr storm event = 83.70%
Acknowledgments • CONACyT • Dr. David Maidment • Gonzalo, Denny, Amanda, and Georges • The EWRE faculty and students • Watershed Protection and Development Review Department of The City of Austin