Download
1 / 21
210 likes | 379 Vues
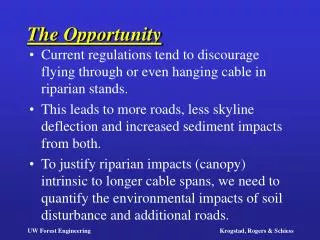
The Opportunity. Current regulations tend to discourage flying through or even hanging cable in riparian stands. This leads to more roads, less skyline deflection and increased sediment impacts from both.

E N D
The Opportunity • Current regulations tend to discourage flying through or even hanging cable in riparian stands. • This leads to more roads, less skyline deflection and increased sediment impacts from both. • To justify riparian impacts (canopy) intrinsic to longer cable spans, we need to quantify the environmental impacts of soil disturbance and additional roads.
Our Approach • This paper provides an intuitive approach to estimating sediment delivery from cable yarding induced soil disturbance. • This approach helps identify how longer spans can dramatically reduce sediment delivery to streams, though increasing riparian canopy disturbance.
Overview • Tradeoffs in Harvest Design • Example: Prospector Creek • Mapping Soil Disturbance • Sediment Delivery • Where Do We Go From Here?
Environmental Tradeoffs of Tailhold Locations Ground Level Riparian Tailhold -minimizes riparian impact -maximizes soil disturbance, especially near stream
Environmental Tradeoffs of Tailhold Locations Riparian Tailtree -minor riparian impact -partial suspension reduces soil disturbance
Environmental Tradeoffs of Tailhold Locations Tailhold across riparian zone -some cable damage to riparian stand -no soil disturbance near riparian zone
Environmental Tradeoffs of Tailhold Locations Tailhold on far side of valley -reduction in road densities -minimizes soil disturbance -increased yarding costs
Necessary Tools and Data • PROGRAMS • ARC/INFO • LOGGERPC • DATA • Contours • Digital Elevation Model • Helpful to have stream, road & timber data • As always, the analysis is only as good as the data that goes into it
Mapping Soil Disturbance ArcInfo LoggerPC Contours Max EYD Landing Streams # of Cable Roads Location Roads Convert Profiles Profile Generate Import X,Y,Z to LoggerPC X,Y,Z Spacing Profile Data Profile Data Format Yarders Profile Carriages Analysis Cable System Recreate Profiles Conversion to LoggerPC with Suspension ArcInfo Generate Report Data Format Cell Convert Profiles to Size ArcGRID format ArcGRID Sediment Analysis
Getting Data Out of Arc Interactive program prompts users for a maximum EYD and the number of cable roads for each landing.
Digitizing Landings Multiple redundant landings can be located in the same harvest unit, then analyzed for total sediment impact.
Mapping Soil Disturbance Hanging Across Stream Hanging Across Valley
Sediment Delivery 1. Assume all soil disturbances produce equal sediment 2. Sediment delivery is a negative exponential distance function 3. Sediment filtering is reduced by soil saturation 4. Soil saturation increases with upslope area 5. Sum downslope filtering to get delivered fraction
Sediment Filtering Fine sediment delivered to the stream unless filtered by soil, vegetation, or litter. Filtering is a negative exponential process: q(x)=q0exp(-ax) x: distance downslope q0: initial sediment q(x): delivered to x a: filter coefficient
Filtering Coefficient Saturation allows sediment to bypass filters h=Q/TS h: saturated thickness (length) Q: saturated flow (volume/time) T: soil hydraulic transmissivity (area/time) S: local slope gradient (length/length) Filter coefficient a 1/h S/Q
Sediment Filtering Sediment Filtering = (slope)/(contributing area) Fraction of sediment reaching the stream q(x)/q0=exp(-a)
Comparing Yarding Options Soil disturbance Across Valley Across Stream Probability of sediment delivery
Sediment Delivery Factors • Management - disturbance of vegetation and litter cover • Soil - silt and clay inhibit infiltration • Precipitation - storm intensities • Contributing Area - the area above each disturbed site can affect sediment delivery • Slope - steeper slope > greater hydraulic gradient > thinner saturated layer > less overland flow > less sediment delivery
GIS Events Modeling Cumulative Impact harvesting stands/roads construction topography fire/blowdown soils surface mass rain-on-snow/ erosion wasting road interception coarse fine peak LWD sediment sediment flows shade stream sensitivity/resource vulnerability cumulative impact
Where do we go from here ? • Develop P.L.A.N.S interface for larger study areas, or incorporate skyline analysis into Arc/Info • Begin to quantify likely sediment delivery • Ultimately, we could begin to assign a cost to sediment, answering the question… What is the cost to the landowner of minimizing sediment input?