Concept Generation/Ideation
Concept Generation/Ideation. Marketing 4250 February 1, 2007. Translating Observations into Interpreted Needs (Empathic Design). Observation Capture “data” - use video or still pictures, don’t write Show “data” to people who didn’t observe first-hand and discuss observations

Concept Generation/Ideation
E N D
Presentation Transcript
Concept Generation/Ideation Marketing 4250 February 1, 2007
Translating Observations into Interpreted Needs (Empathic Design) • Observation • Capture “data” - use video or still pictures, don’t write • Show “data” to people who didn’t observe first-hand and discuss observations • Brainstorm for solutions
Translating Verbatim Statements into Interpreted Needs • Identify the benefit and not the function (what the product does, not how it should/must do it). “I want a 1/4” hole, not a 1/4” drill bit.” • Describe an attribute of the product or the user • If possible, avoid words like “must” and “should.”
Designing a Kitchen Tool Customer Comment Interpreted Needs “It hurts my hand.” “The tool is comfortable.” “It only does one thing.” “The tool can peel, gouge, cut, etc.” “It is not very attractive.” “The tool looks stylish.”
Designing a Coffee-Making Machine Verbatim Needs Interpreted Needs “I would like it to remind me of an English butler.” ”I hate it when it drips if I pull out the pot or the filter.” “I don’t like having the cord stretched all over the counter.” “I just want a good tasting cup of Joe.” The product is elegant and unassuming, with clean lines. The product keeps itself and the area around it clean. The product has good cord management. The product makes good coffee. The product heats and keeps water at the appropriate temperature.
Structuring the Interpreted Needs • Categorize the interpreted needs into a smaller number of categories. • What “primary interpreted needs” labels should we attach to these categories?
Prioritizing Interpreted Needs • Kano Classification (one approach) • L =Linear Satisfiers (“The more the merrier.”) • N =Neutral/Indifferent (“No big deal.”) • M =Must Haves (“I won’t buy without!”) • D =Delighters (“What an unexpected treat!”)
Delighter (D) Linear Satisfier (L) Requirement Not Fulfilled Indifferent (I) Requirement Fulfilled Must Have (M) Kano’s Model of (Non-Linear) Customer Satisfaction Customer Satisfied Customer Dissatisfied See (1) Matzler, et al.., 1996, Journal of Product & Brand Mgmt (2) Matzler and Hinterhuber, 1998, Technovation (3) Center for Quality Mgmt
EMPATHIC (OBSERVATION) VS. USER ARTICULATION (INQUIRY) Strengths Weaknesses - Technique relies upon well- trained observers who can convert observations to innovative solutions. - Inability to measure attitudes. - Innovation possible beyond what users are able to tell you. - Technique relies upon real actions. Empathic (Observation) User Articulation (Inquiry) - Users may be unable to articulate needs (e.g unnoticed workarounds). - Interview/interaction process may bias response. - Information can be acquired on attitudes and reasoning from users. - Easy to acquire information.
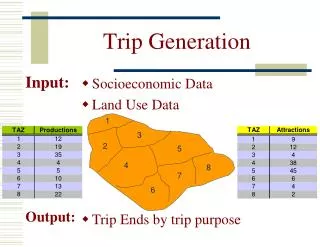
Interpreted Needs Product Specifications Product Concepts Translating the “Voice”-of-the-Customer Customer Verbatims Observations Scenario Planning Or Market Driving Forecasting
What is a Product Concept? • A concept includes: • a specific product form (the attributes) • a specific technology (the source of the form) • a specific benefit for a particular usage situation • see Page and Rosenbaum (1992), “Developing an Effective Concept Testing • Program for Durables,” J Product Innovation Mgmt
Definition of a Creative Concept: One that is both originalANDuseful
No Situation Effects Some Situation Effects Strong Situation Effects Creativity:is it an individual trait or is it situation-driven? • Both • Individual Trait: • Scientific Creativity (Engineer, Chemist) • Artistic Creativity (Painter, Composer) • Combo (Inventor) -- rare • Situation-Driven: • No creative ability • Low creative ability • Some creative ability
Strategy Implications • Individual Trait • Use Cross-Functional Teams • Use Personality Testing in Hiring • Situational Effects • Culture/Processes (3M, TI, IDEO, Kellogg’s) • “No more mistakes and you’re through!” - John Cleese • Reward Structures (IBM, Campbell’s) • Ideation Strategies (Analogies) • Analytical Strategies (Perceptual Mapping, Relationship Analysis, Morphological Matrix)
But, do you know creativity when you see it?
Are these creative new product concepts?
Concept Generation / Ideation • Step 1: Clarify the Problem • Step 2: Search Externally • Step 3: Search Internally • Step 4: Explore Systematically • Step 5: Reflect on the Results and the Process
Concept Generation / Ideation • Step 2: Search Externally • Experts - Lead User Analysis • Lead Users - experience the need ahead of the mass market; not the same as early adopters
General Principle of Lead User Research • Extreme versus Means • Identification of functionally novel products and service concepts should be done at the leading edge of markets and applications • Evaluation of commercial potential should be done at the “means” of markets and market segments
Category Health Products Personal Care Sports Food Office Computers Apparel Example Gatorade Protein-based Shampoo Mountain Bike Chocolate Milk White-out Liquid E-mail, Desktop Publishing Sports Bra Important Innovations by Consumers
Benefiting from Lead Users • Lead User innovations form the basis for new products and service of value to manufacturers. • Lead Users • Have new product or service needs that will be general to the marketplace, but they face them months or years before the bulk of the market • Expect to benefit significantly by finding a solution to those needs
Adopter Categorization on the Basis of Innovativeness • Lead users are not the same as “early adopters”
Concept Generation / Ideation • Step 2: Search Externally • Experts - Lead User Analysis • Lead Users - experience the need ahead of the mass market; not the same as early adopters • Interviewing • Observation - Empathic Design • Focus Groups
Concept Generation / Ideation • Step 3: Search Internally • Analogy • Near Vs. Far • Relations Vs. Attributes
Exercise • A recent article in the Wall Street Journal identified the difficulties and problems inherent in eating in a moving vehicle. • “Automotive dining” has created a new opportunity for an innovative product introduction. • You are asked to develop a new product concept that will meet the needs/solve the problems of the commuting diner.
Results • Teams of 2 Designers • Texas Instruments • TXS Industrial Design • Ignition
Results from comprehensive study • Number of benchmarks or no benchmark • Design Strategy - use many vs. few analogies • Results:
Concept Generation / Ideation • Step 4: Explore Systematically • GAP Analysis with Perceptual Maps • Determinant GAP Maps
A Determinant GAP map exercise • Sandwich shops in Boulder • Make a list of 10-12 sandwich shops in Boulder • Include: • Deli Zone • Half Fast Subs on the Hill • Jimmy Johns • Snarfs • Subway • Silvermine Subs • Think about the shops and use your judgement to identify the two most important factors that differentiate them from each other. Use those factors as axes • Place all of the shops on your list onto the map • Are there any noticeable gaps? How do you interpret them?
Concept Generation / Ideation • Step 4: Explore Systematically • GAP Analysis with Perceptual Maps • Determinant GAP Maps • Perceptual Maps based on Attribute Ratings (AR)
Data Reduction Using Multivariate Analysis • Factor Analysis • Reduces the original number of attributes to a smaller number of factors, each containing a set of attributes that “hang together” • Cluster Analysis • Reduces the original number of respondents to a smaller number of clusters based on their benefits sought, as revealed by their “ideal brand”
Obtaining Customer Perceptions Rate each brand you are familiar with on each of the following:Disagree Agree 1. Attractive design 1..2..3..4..5 2. Stylish 1..2..3..4..5 3. Comfortable to wear 1..2..3..4..5 4. Fashionable 1..2..3..4..5 5. I feel good when I wear it 1..2..3..4..5 6. Is ideal for swimming 1..2..3..4..5 7. Looks like a designer label 1..2..3..4..5 8. Easy to swim in 1..2..3..4..5 9. In style 1..2..3..4..5 10. Great appearance 1..2..3..4..5 11. Comfortable to swim in 1..2..3..4..5 12. This is a desirable label 1..2..3..4..5 13. Gives me the look I like 1..2..3..4..5 14. I like the colors it comes in 1..2..3..4..5 15. Is functional for swimming 1..2..3..4..5
Selecting the Number of Factors The Scree Percent Variance Explained No. of Factors
Factor Loading Matrix Figure 6.7
Factor Scores Matrix Figure 6.8 Sample calculation of factor scores: From the snake plot, the mean ratings of Aqualine on Attributes 1 through 15 are 2.15, 2.40, 3.48, …, 3.77. Multiply each of these mean ratings by the corresponding coefficient in the factor score coefficient matrix to get Aqualine’s factor scores. For example, on Factor 1, Aqualine’s score is (2.15 x 0.145) + (2.40 x 0.146) + (3.48 x -0.018) + … + (3.77 x -0.019) = 2.48. Similarly, its score on Factor 2 can be calculated as 4.36. All other brands’ factor scores are calculated the same way.
Comfort Aqualine Gap 1 Islands Molokai Fashion Splash Sunflare Gap 2 The AR Perceptual Map Figure 6.9
Concept Generation / Ideation • Step 4: Explore Systematically • GAP Analysis with Perceptual Maps • Determinant GAP Maps • Perceptual Maps based on Attribute Ratings (AR) • Perceptual Maps Based on Overall Similarities (OS)
Dissimilarity Matrix Figure 6.10
Aqualine Comfort Molokai Islands Fashion Sunflare Splash The OS Perceptual Map Figure 6.11
Analytical Strategies • Step 4: Explore Systematically • GAP Analysis with Perceptual Maps • Relationship Analysis Event Insured Against Person/Animal Insured New- borns Dogs/ Cats Tropical Birds New Jobholders Newlyweds Geniuses Injury from Fire Getting Lost Normal Death Kidnapping Being Insulted
Analytical Strategies • Step 4: Explore Systematically • GAP Analysis with Perceptual Maps • Relationship Analysis Gap Analysis • Morphological Matrix Dimension 2: Ingredients Dimension 3: Object to be Cleaned Dimension 4: Package Dimension 5: Substance Removed Dimension 1: Cleaning Instrument Aerosol Bag Bottle Can Tube Broom Brush Sponge Steel Wool Vacuum Alcohol Ammonia Disinfectant Pine Oil Air Boat Carpet Floor Fence Blood Dirt Mildew Paint Rust