Download
1 / 25
250 likes | 342 Vues
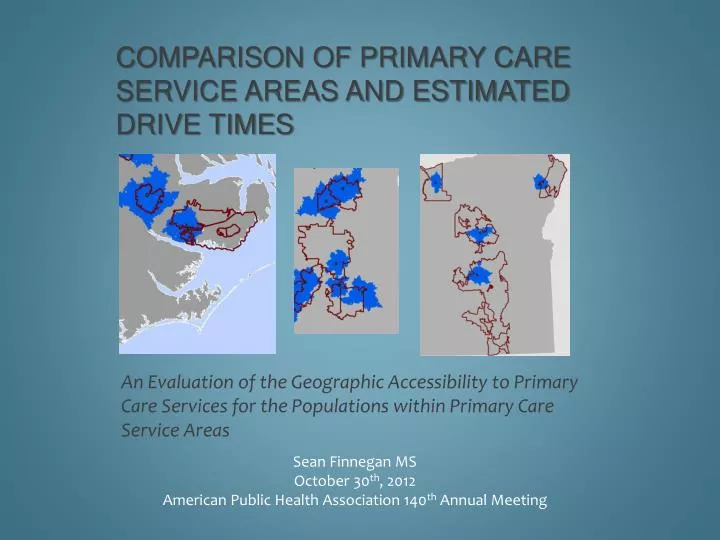
Comparison of Primary Care Service Areas and Estimated Drive times. An Evaluation of the Geographic Accessibility to Primary Care Services for the Populations within Primary Care Service Areas. Sean Finnegan MS October 30 th , 2012 American Public Health Association 140 th Annual Meeting.

E N D
Comparison of Primary Care Service Areas and Estimated Drive times An Evaluation of the Geographic Accessibility to Primary Care Services for the Populations within Primary Care Service Areas Sean Finnegan MS October 30th, 2012 American Public Health Association 140th Annual Meeting
Healthcare service areas allow for the measurement of health outcomes, assessment of health care services utilization and healthcare shortage area designation • Healthcare service areas have been at the center of policy decisions and are vital for the efficient distribution of federal and state funds • This research compared rural Primary Care Service Areas (PCSAs) to estimated 30-minute drive-time polygons centered on a primary care service access point within each PCSA Background and Objective
Developed by the Dartmouth Institute 2003 • Service areas defined primarily from Medicare claims data • Comprised of ZIP Code Tabulation Areas (ZCTAs) • Plurality of services dictate which ZCTA belongs to which group • ZCTAs reassigned for contiguity • Currently only consider distance in 2 ways: • ZIP Code Centroid distances between Provider ZIP and Beneficiary ZIP • Land Area of 1,256 square miles Primary Care Service Areas (PCSA)
Missouri • Oregon • North Carolina • Rural PCSAs with a Rural Urban Commuting Area classified as “Small Rural” or “Isolated” • Containing a single primary care physician from which to calculate the estimated drive times Study Area
Data Esri Road Network National Provider Identifier Primary Care Service Areas
National Provider Identifier Data from CMS Rural Primary Care Service Areas Primary Care Physician Locations Select Block Centroids Completely Within Rural PCSAs Record Population Counts Rural PCSAs Projected to an Albers Equal Area Projection and Area Calculated Rural PCSAs with Single Primary Care Physician Remove from Rural PCSA Selection Block Centroids Completely Within Estimated Drive Time Polygons Calculate Block Centroids XY Coordinates in Albers Equal Area Projection 2010 United States Census Primary Care Service Areas Data and Methods Primary Care Physician Locations Select Block Centroids Completely Within Estimated Drive Time Polygons Record Population Counts Rural PCSAs RuralUrban Commuting Area Data (USDA and WWAMI) Estimate 30 Minute Drive Time Polygons Drive Time Polygons Projected to an Albers Equal Area Projection and Area Calculated Estimate Travel Times Calculated based on FCC Codes 30 (.5 hour) Minute Travel Time Service Area Polygons Built Road Networks Projected to an Equidistant Projection Road Network Data
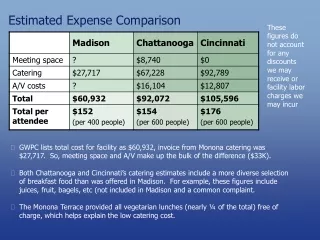
Areas of each PCSA and corresponding estimated drive time • Populations within each PCSA and drive time • Population within the PCSA that did not fall within the drive time • Correlation between the total populations in PCSAs and the Populations outside of the estimated drive times • Additional Comparison of 20 and 40 minute drive time polygons Quantitative Comparison
Missouri Results Oregon North Carolina
72 percent of the PCSAs analyzed had populations that could have potential geographic accessibility issues for primary care • More than 14 percent of the population of the PCSAs in the study area were outside of the drive time polygons • In the poorest performing PCSAs, greater than 42 percent of the population fell outside of the estimated 30 minute drive time polygons • The area of the PCSAs sampled in Oregon was greater than the area of the polygons based on estimated drive times Key Findings
While PCSAs may be a good start at defining actual primary care service areas there are some that may not be appropriately representing the population actually served in these areas • Some consideration to distance, such as estimated drive times, should be considered to address the geographic accessibility for populations within PCSAs Conclusions
Larger PCSAs may be a result of primary care service shortages (Health Professional Shortage Areas) and therefore may need policy interventions to encourage additional primary care services • In order to ensure access to health care for all citizens as outlined in the Patient Protection and Affordable Care Act, more consideration needs to given to geographic accessibility to health care services Policy Implications
Evaluation of data used in the PCSA project to assess whether an element of travel time would increase the outcomes of the PCSAs original goals • The evaluation of estimated drive times and their accuracy compared to actual drive times • An evaluation of estimated drive time polygons and Euclidian distance buffers to see how well their population coverage is correlated • Dartmouth has decided to recreate PCSAs with Census Tracts Future Research
My thesis advisor and committee Drs. Waters, Curtin and Leslie • The Robert Graham Center, especially Dr. Jennifer Rankin, Dr. Andrew Bazemore and Dr. Bob Phillips Acknowledgements
Questions ? Sean Finnegan MS sfinnegan@aafp.org