Download
1 / 7
70 likes | 229 Vues
Review of Z-Scores and the Normal Distribution. What 68% of you should know 99.7% of the time; what 99.7% of you should know 68% of the time; and what all of you should know all of the time!. Section 1.3 – a critical part. Go to Normal Distribution Applet How is the z-score calculated?

E N D
Review of Z-Scores and the Normal Distribution What 68% of you should know 99.7% of the time; what 99.7% of you should know 68% of the time; and what all of you should know all of the time!
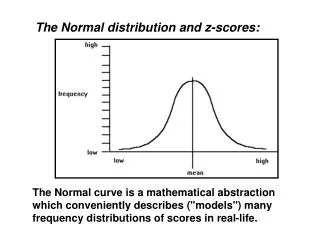
Section 1.3 – a critical part • Go to Normal Distribution Applet • How is the z-score calculated? • Why does it make sense that it depends on two characteristics of the population? • What is an N(0,1) distribution? • What fraction of a population is found between z = -0.85 and z = 1.65? Sketch this. • How would relate a 95% confidence level to a N-distribution? How would it appear as a sketch on the N-distribution curve? • What is the 68-95-99.7 rule?
Examples… • Do all data sets fit a N-distribution? • How about this:
Testing the data for normality… • Histogram • Normal Quantile Plot
Applying the N-distribution • Look at the last mid-term: • On March 18, 2007 CBC hosted the first national IQ test. The test pitted seven studio groups against each other and also had an on-line participation of over 100 000 Canadians. We know from large population samples that IQ scores are normally distributed. • If the average IQ is 100 what fraction of the population will you expect to score within ± 1 s of the mean? (1 marks) • The highest scoring studio participant scored 137 which placed him in the top 2% of national IQ scores. Estimate the standard deviation of IQ scores from this. (3 marks)
Example • The King’s grading policy (like most universities) stipulates that a “typical” class should have a 13% failure rate, and 17% receiving A- or above. Suppose a large Psych class final exam (n = 100) had a roughly normal distiribution of test scores with s = 8.9% and m = 62.4%. Where should the pass-fail and A- and above grade cut-offs be set?
Group Work… • Do the following problems dealing with z-scores: • 1.97, 1.98 and 1.99 (pg 88) • An interesting Minitab problem – 1.132