Download
1 / 14
140 likes | 237 Vues
Analyzing Stephanie and Tavia's marks for a Data Management award using z-scores. Learn how to calculate and compare z-scores to determine the deserving recipient. Understand the concept of standard normal distribution and outlier detection.

E N D
Comparing marks • Stephanie and Tavia are both in the running for the Data Management award. Stephanie has 94% and Tavia has 92%, from different classes. • Who deserves the award? • What if I told you it was Tavia? • Why?
Stephanie’s class: mean 78, = 9.36 Tavia’s class: mean 73, = 8.19 • Distributions are different • Fair comparison not possible …yet
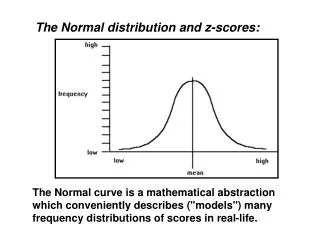
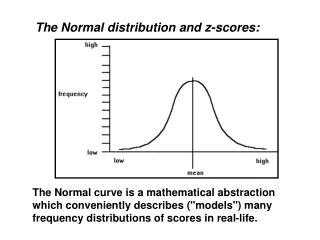
Standard Normal Distribution • Mean 0, standard deviation 1 • Can translate each element of a normal distribution to standard normal distribution by finding number of a given score is away from the mean • this process is called standardizing
z-scores • z = The number of standard deviations a given score x is above or below the mean • z = z-score • Positive: value lies _________ the mean • Negative: value lies _________ the mean above below
Example 1: Calculating z-scores • Consider the distribution • Find the number of standard deviations each piece of data lies above or below the mean. • A) x = 11 B) x = 21.5 Note: z-scores are always rounded to 2 decimal places
Example 2: Comparing data using z-scores • Stephanie and Tavia are both in the running for the Data Management award. Stephanie has 94% and Tavia has 92%. If Stephanie’s class has a mean of 78 and = 9.36, and Tavia’s class has a mean of 73 and = 8.19. Who deserves the award?
Example 2 • Use z-scores: • Stephanie: Tavia Tavia’s z-score is higher, therefore her result is better.
z-Score Table • appendix B, pp. 398-399 of text • Determines percentage of data that has equal or lesser z-score than a given value Example: P(z < -2.34) = 0.0096 Only 0.96 % of the data has a lower z-score, and 1 – 0.0096 = 99.04% of the data has a higher z-score
Note • Notice z-score table does not go above 2.99 or below –2.99 • Any value with z-score above 3 or less than –3 is considered an outlier • If z > 2.99, P(z < 2.99) = 100% • If z < -2.99, P(z < -2.99) = 0% • If z = 0, P(z < 0) = 50% • The data point is the mean
Percentiles • The kth percentile is the data value that is greater than k % of the population • Example z = 0.40 z = 1.67 65.54 % of the data are below this data point. It is in the 66th percentile. 95.25 % of the data are below this data point. It is in the 96th percentile.
Example 3: Finding Ranges • Given , find the percent of data that lies in the following intervals: A) 3 < x < 6 B) x > 8.6 For x = 3, For x = 6,
Example 3: Finding Ranges • Given , find the percent of data that lies in the following intervals: • A) 3 < x < 6 B) x > 8.6 So 29.20% of the data fills this interval.
Example 3: Finding Ranges • Given , find the percent of data that lies in the following intervals: • A) 3 < x < 6 B) x > 8.6 For x = 8.6, So 23.27% of the data lies above 8.6.