Normal Distributions and Standard Scores
190 likes | 544 Vues
History of the Normal Curve. The scores of many variables are normally distributedNormal DistributionGaussian Distribution. Sir Francis Galton (1822-1911). Carl Friedrich Gauss (1777-1855). Properties of the Normal Curve. Bell-shapedUnimodalSymmetricalExactly half of the scores above the meanExactly half of the scores below the mean.

Normal Distributions and Standard Scores
E N D
Presentation Transcript
1. Normal Distributions and Standard Scores
2. History of the Normal Curve The scores of many variables are normally distributed
Normal Distribution
Gaussian Distribution
3. Properties of the Normal Curve Bell-shaped
Unimodal
Symmetrical
Exactly half of the scores above the mean
Exactly half of the scores below the mean
4. Properties of the Normal Curve Bell-shaped
Unimodal
mean = median = mode
Symmetrical
Tails are asymptotic
i.e., never touch the x axis
5. Properties of the Normal Curve
6. The Normal Curve The Theoretical Normal Distribution
Area under the curve = 1
no matter what the mean and standard deviation of the curve
The Y-axis is labelled Relative Frequency
7. The Normal Curve The Empirical Normal Distribution
The empirical distribution is an approximation to the theoretical distribution
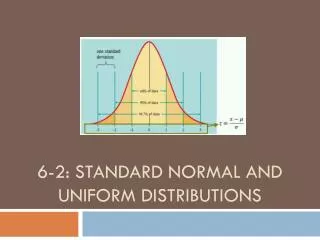
8. The Normal Curve There are known percentages of scores above or below any given point on a normal curve
34% of scores between the mean and 1 SD above or below the mean
An additional 14% of scores between 1 and 2 SDs above or below the mean
Thus, about 96% of all scores are within 2 SDs of the mean (34% + 34% + 14% + 14% = 96%)
Note: 34% and 14% figures can be useful to remember
9. The Standard Normal Curve �A standard score expresses a score�s position in relation to the mean of the distribution, using the standard deviation as the unit of measurement�
�A z-score states the number of standard deviations by which the original score lines above or below the mean�
Any score can be converted to a z-score as follows
The standard normal distribution has a mean of 0 and a standard deviation of 1.
10. The Normal Curve Table Normal curve table gives the precise percentage of scores between the mean (z score of 0) and any other z score.
Can be used to determine
Proportion of scores above or below a particular z score
Proportion of scores between the mean and a particular z score
Proportion of scores between two z scores
NOTE: Using a z score table assumes that we are dealing with a normal distribution
If scores are drawn from a non-normal distribution (e.g., a rectangular distribution) converting these to z scores does not produce a normal distribution.
12. Normal Curve Table Continued The Z table can also be used to.
determine a z score for a particular proportion of scores under the normal curve, and
Determine the proportion of scores below (or above) a negative z score
13. Finding Area When the Score is Known To find the proportion of the curve that lies above or below a particular score
Convert raw score to z score, if necessary
Draw a normal curve
Indicate where z score falls
Shade area you�re trying to find
Make rough estimate of shaded area�s percentage
Find exact percentage with normal curve table
Check to verify that it�s close to your estimate
14. Finding Area When the Score is Known To find the proportion of the curve that lies between two scores
Convert the raw scores to z scores
Draw a normal curve
Indicate where the two z scores fall
Shade area you�re trying to find
Make rough estimate of shaded area�s percentage
Find exact percentage with normal curve table
Check to verify that it�s close to your estimate
15. Finding Scores When the Area is Known Draw normal curve, shading approximate area for the percentage desired
Make a rough estimate of the Z score where the shaded area starts
Find the exact Z score using normal curve table
Check to verify that it�s close to your estimate
Convert Z score to raw score, if desired
16. !!! Remember !!! We can use the standard normal distribution table (Table A in Appendix C) ONLY when our distribution of scores is normal.
Using the standard normal table is not appropriate if our distribution differs markedly from normality
e.g.,
rectangular
skewed
leptokurtic
bimodal
17. Comparing Scores from Different Distributions Again: The standard normal distribution has a mean of 0 and standard deviation of 1
Consider two sections of statistics
Gurnsey�s class has a mean of 80 and S of 5
Marcantoni�s class has a mean of 70 and S of 5
Student 1 gets 80 in Gurnsey�s class
Student 2 gets 75 in Marcantoni�s class
Which student did better?
18. Interpreting Effect Size Assuming two normal distributions, we can compute effect size (ES) to determine the proportion of one distribution that falls below the mean of the other distribution
Effect size is essentially a kind of z score; i.e., it tells us how many standard deviation units separate the two means
if Mean1 = 100, Mean2 = 130 and Spooled = 15
what is the effect size and,
what proportion of Distribution1 falls below the mean of Distribution2?
19. Percentile Ranks and the Normal Distribution When we ask what proportion of a distribution lies below a particular z score, we are actually asking what is the percentile rank of the score
e.g., in a distribution with a mean of 100 and standard deviation of 15, 84% of the distribution falls below a score of 115 [z = (115-100)/15 = 1].
Therefore, the percentile rank of 115 is 84%
20. The Normal Curve and Probability We haven�t discussed probability yet but it is a concept directly related to the normal curve
The probability of an event is the proportion of times that the event would be expected to occur in an infinitely long series of identical sampling experiments.
The normal curve can be described as a probability distribution because it can tell us the probability of a score falling within some interval.
What is the probability that a score chosen at random from a normal distribution fall below the mean?
What is the probability that a score chosen at random from a normal distribution will fall below one standard deviation above the mean?