Download
1 / 29
290 likes | 410 Vues
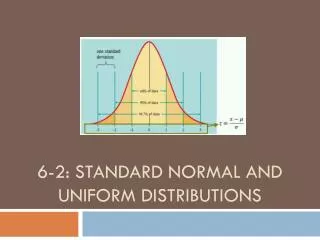
6-2: Standard Normal and Uniform Distributions. IMPORTANT CHANGE. Last chapter, we dealt with discrete probability distributions. This chapter we will deal with continuous distributions. We are not focused on the probability of a specific data value, instead we care about ranges.

E N D
IMPORTANT CHANGE Last chapter, we dealt with discrete probability distributions. This chapter we will deal with continuous distributions. We are not focused on the probability of a specific data value, instead we care about ranges.
Topics • Normal Distributions in General • Probability as an Area • Uniform Distributions • Standard Normal Distribution • Calculating Probability • Calculating Z-Score
Normality is based on standard deviation and mean. There is a formula that can be used to describe the curve based on these parameters, however, we will not need to use it in this course. Normal Distribution: A continuous probability distribution that is symmetric and bell-shaped. MEAN
Probability as an Area • The graph representing a continuous distribution is also known as a density curve. • The total area under the curve must equal 1 • Every point has a height of 0 or greater • Using this information, we can use area to represent probability. • This will start to make sense within the context of problems.
Uniform Distribution • A distribution is uniform if its probability remains the same for the entire range of possibilities. P(x) x
Example Ace Heating and Air Conditioning Service finds that the amount of time a repairman needs to fix a furnace is uniformly distributed between 1 and 5 hours. Find the probability that it takes more that 3.5 hours. .375 .25 Prob 0 time 1 5
You Try! A power company provides electricity with voltage levels that are uniformly distributed across 123.0-125.0. Find the probability that a randomly selected voltage is greater than 124.5. .25 .5 Prob 0 voltage 123.0 125.0
Suggested Practice from p.261+ • Uniform Distribution: 5-8 • Find Probability from Left: 9, 17, 19 • Find Probability from Right: 10, 21, 23 • Find Probability in the Middle: 12, 25, 29 • Find z Score from Left: 13, 50 • Find z Score in Middle: 51 • Find z Score from Right: 42, 43
-3 -2 -1 0 1 2 3 Standard Normal Distribution • The standard normal distribution is a special case of the normal distribution in which the mean is 0 and the standard deviation is 1. AREA z Scores
Area and z Scores • z Score: As it was before z-scores represent distance on the horizontal scale (# of standard deviations from mean). • Area: The region under the curve bounded by a specific parameter or parameters.
Calculating Probability • Just like the uniform distribution, the area under the curve represents probability. • Calculating area is much more difficult with a curve, so we will refer to table A-2 which does the calculations for us. • The table refers to the area under the curve up to the specific z Score from the LEFT • DRAW A PICTURE FOR EVERY PROBLEM!!!
Example • A company that makes thermometers realizes that their product is not completely accurate. When the temperature is actually 0°, it sometimes reads slightly above or slightly below 0°. They find that this range is normally distributed with a mean of 0° and standard deviation of 1°. Find the probability that the thermometer reads less than 1.27°. 0.8980
You try! • A new card game called 3’s has a normal distribution for earnings, with the mean winnings being $0, and a standard deviation of a $1. What is the probability of losing more than $1.50? 0.0668
Question • What if they ask you to find area from the right? • Since the area is equal to 1, you can find the probability from the left (B) and the area from the right is A = 1 – B
You try! • Using the previous thermometer example, find the probability of randomly selecting one thermometer that reads above -1.23°. 0.8907
Example • Using the thermometer example, find the probability that the temperature is between -2.00° and 1.50°. 0.9104
Big Note! • If the area is bound between two numbers, find the probability from the left for both values, and subtract! • Remember area, like probability cannot be negative!
Suggested Practice from p.261+ • Uniform Distribution: 5-7 • Find Probability from Left: 9, 17 • Find Probability from Right: 10, 21 • Find Probability in the Middle: 12, 25 • Find z Score from Left: 13, 50 • Find z Score in Middle: 51 • Find z Score from Right: 42, 43
Homework Quiz • Find the probability that a quarterback sneak results anywhere from a loss of 1 yard through a gain of 1.5 yards given that the probability fits a standard normal distribution with a and 0.7745
Finding the z Score, Given Probability • From the left: • Find the given probability in the table and figure out which z Score corresponds with it. • Bounded on both sides: • Treat each end separate • From the right: • Find the z Score that goes with the complement
Example • Using the thermometer example from earlier in the section, find the temperature that would represent the 89th percentile (the temperature separating the bottom 89% from the top 11%). 1.23
Big Note! • If the area you are looking for in the table cannot be found exactly, but you see 2 z Scores that produce areas slightly above and slightly below that value, then just take the z score closest to the value you are looking for. • Example: Look for the z score that produces an area of .800.
Example • Use the “quarterback sneak” example to find the yardage that would represent the 99th percentile. 2.33
Example • Using the thermometer example, find the z Scores that separate the bottom 5% and the top 5%. -1.645 and 1.645
One last thing… • The notation represents the z Score producing an area of to its RIGHT • To find , use the table to find the z Score that corresponds with a probability/area of
Example • Find -1.645
Suggested Practice from p.261+ • Uniform Distribution: 5-7 • Find Probability from Left: 9, 17, 19 • Find Probability from Right: 10, 21, 23 • Find Probability in the Middle: 12, 25, 29 • Find z Score from Left: 13, 14, 50 • Find z Score in Middle: 51 • Find z Score from Right: 15, 16, 42, 43
Homework (graded for correctness) • Complete worksheet!