Download
1 / 35
350 likes | 367 Vues
Explore accessibility indicators & impacts of transport scenarios on economy, climate, and policies across regional, European & global levels. Update studies & datasets for improved accessibility insights. Identify challenges & solutions for sustainable development.

E N D
TRACC TRansport ACCessibility at Regional/Local Scale and Patterns in Europe ESPON 2013 Programme Internal Seminar Crossing Knowledge Frontiers – Serving the Territories 17-18 November 2010 Liège, Belgium
TPG • Spiekermann & Wegener, Urban and Regional Research (S&W), Dortmund, Germany (Lead Partner) • Charles University in Prague, Department of Social Geography and Regional Development, Prague, Czech Republic • RRG Spatial Planning and Geoinformation, Oldenburg, Germany • Mcrit, Barcelona, Spain • University of Oulu, Department of Geography, Oulu, Finland • TRT Trasporti e Territorio, Milan, Italy • S. Leszczycki Institute of Geography and Spatial Organisation - Polish Academy of Sciences, Warsaw, Poland
Accessibility • main 'product' of a transport system • determines the locational advantage of an area (i.e. in ESPON a region, a city or a corridor) relative to all areas (including itself) • indicators of accessibility measure the benefits households and firms in an area enjoy from the existence and use of the transport infrastructure relevant for their area. • The important role of transport infrastructure (i.e. networks and transport services) for spatial development in its most simplified form implies that areas with better access to the locations of input materials and markets will, ceteris paribus, be more productive, more competitive and hence more successful than more remote and isolated areas.
Key policy questions • What are the differences between accessibility at three different levels (regional, European and global) considering the four modes road, rail, water and air? • What is the link between accessibility at the different levels and for different modes of European regions and their economic development? How has this link changed over time? Does the strength of this link differ across the EU? • What could be the territorial impact of rising energy prices on the future developments of road, rail, water and air transport? • What could be the impact of various transport scenarios on climate change, access patterns and economic development?
Main objectives • to take up and update the results of existing studies on accessibility at the European scale using most recent available network and socio-economic data, • to extend the range of accessibility indicators by further indicators responding to new policy questions and further developing the quality and validity of the existing indicators, • to extend the spatial resolution of accessibility indicators by calculating, besides European accessibility, also global and regional accessibility, • to explore the likely impacts of available policies at the European and national scale to improve global, European and regional accessibility in the light of new challenges, such as globalisation, energy scarcity and climate change.
Conceptual framework based on Dimensions of accessibility: Origins, destinations, impedance, constraints, barriers, types of transport, modes, spatial scale, equity, dynamics Generic accessibility indicators: Activities Impedance
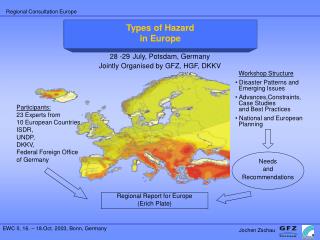
Methodological dimension • Overview on state of the art of accessibility research from the global to the local scale. • Overview on assessing impacts of accessibility improvements on regional development, energy consumption and greenhouse gas emission by transport. • Proposal for a core set of accessibility indicators. • Continuity and innovation
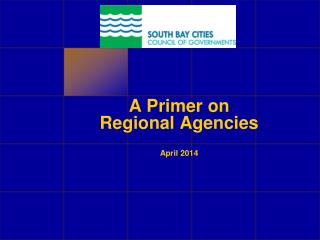
Data dimension • Review of available network data at European and regional scale • Review of available socio-economic data at European and regional scale • Network and socio-economic datasets customised for all accessibiltiy and impact modelling at all scales addressed. • Geographical coverage: ESPON space, EU candidate countries and other countries of the Western Balkans.
RRG Road Database
RRG Rail Database
European (and global) travel dimension • Update of potential accessibility indicators (road, rail, air, multimodal) to 2011 plus dissaggregate approach. • Other and innovative types of accessibility indicators. • Global accessibility indicators to destinations outside Europe by air and road/rail to Asia
Potential accessibility rail 2001 (EU27+2=100)
Potential accessibility multimodal 2001 (EU27+2=100)
How to look at changes? Accessibility, rail Relativechange 2001-2006 (in percent)
How to look at changes? Accessibility, rail Absolutechange 2001-2006 (EU27 average 2006 = 100)
How to look at changes? Change ofindex (EU27 = 100)
European (and global) freight dimension • Standard European freight accessibility indicators for selected commodities by road, rail, water, air. • Other and innovative types of freight accessibility indicators. • Global accessibility indicators to destinations outside Europe by air and sea and selected road/rail to Asia.
Regional dimension • Typology of regional/local accessibility patterns in different types of regions. • Set of regional case studies with harmonised analyses of regional/local accessibility. • European-wide regional accessibility indicators. • Comparison of regional and European accessibility indicators. • "For the daily life of citizens regional/local accessibility may be more importany than global or European accessibility”
Selected macro regions for case studies Regional dimension • Typology of regional/local accessibility patterns in different types of regions. • Set of regional case studies with harmonised analyses of regional/local accessibility. • European-wide regional accessibility indicators. • Comparison of regional and European accessibility indicators.
Impact dimension • Analysis of the relationship between accessibility and economic development and environmental indicators over time. • Consistent set of long-term scenarios of European transport. • Likely spatial impacts of European transport scenarios up to the year 2030 (regional accessibility, regional economic development, territorial cohesion, poliycentricity, environmental impacts).
Accessibility v. GDP/capita
TEN-T priority projects
Production function Migration function Accessibility Income Transport policy GDP Population Labour force Unemploy- ment Employment SASI model
Accessibility road/rail/air travel Scenario AS1 v. 000 2021 Brenner tunnel effect Strasbourg Strasbourg Wien Wien München München Zürich Zürich Bolzano Bolzano Trento Trento Ljubljana Ljubljana Lyon Lyon Milano Milano Venezia Venezia Torino Torino Accessibility road/rail/air travel Scenario 000 2021 Reference Scenario
GDP per capita (EU27+2 = 100) Scenario AS1 v. 000 2021 Brenner tunnel effect Erreichbarkeit Straße/Schiene Güter Szenario AS1 v. 000 2021 Brennertunneleffekt Accessibility road freight Scenario AS1 v. 000 2021 Brenner tunnel effect Strasbourg Strasbourg Strasbourg Wien Wien Wien München München München Zürich Zürich Zürich Bolzano Bolzano Bolzano Trento Trento Trento Ljubljana Ljubljana Ljubljana Lyon Lyon Lyon Milano Milano Milano Venezia Venezia Venezia Torino Torino Torino
Energy price scenarios: accessibility road/rail/air (million) Accessibility road/rail/air (mio)
Scenario A1 GDP per capita Difference from Scenario A-1 2031 (%) 8 - 10 6 - 8 4 - 6 2 - 4 0 - 2 -2 - 0 -4 - -2 -6 - -4 -8 - -6 -10 - -8 33
Policy dimension • Summary of project findings in relation to the goals of the European Union (competitiveness, territorial cohesion and environmental sustainability) for different types of regions. • Evaluation of policy instruments to maintain and improve regional accessibility and to draw as much benefit for regional development with smallest possible negative implications. • Avenues for further applied research on the theme of accessibility at global, European and regional scale.
Reporting • Inception Report July 2010 (available at www.espon.eu) • Interim Report January 2011 • Draft Final Report January 2012 • Final Report May 2012