Download
1 / 33
330 likes | 598 Vues
User- and Process-Driven Dynamic Voltage and Frequency Scaling. Bin Lin Arindam Mallik Peter Dinda Gokhan Memik Robert Dick Empathic Systems Project Department of Electrical Engineering and Computer Science Northwestern University http://empathicsystems.org. Summary.

E N D
User- and Process-DrivenDynamic Voltage and Frequency Scaling Bin Lin Arindam Mallik Peter Dinda Gokhan Memik Robert Dick Empathic Systems Project Department of Electrical Engineering and Computer Science Northwestern University http://empathicsystems.org
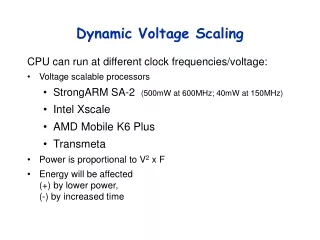
Summary • User-Driven Frequency Scaling (UDFS) • Adjust CPU frequency according to satisfaction of individual user, exploiting variation in satisfaction among users • Process-Driven Voltage Scaling (PDVS) • Adjust voltage at frequency and temperature based on profile of the individual processor, exploiting variation among processors • ~50% power reduction on Windows tasks compared to Windows DVFS • User study, measured system power
Outline • Summary • User-Driven frequency scaling (UDFS) • User pessimism study • UDFS2 algorithm • Process-Driven voltage scaling (PDVS) • PDVS profiling • Evaluation of UDFS and PDVS • Work in context • Conclusion
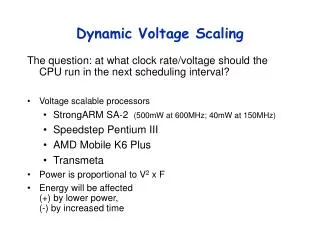
User Satisfaction With CPU Frequency • How satisfied are users of different applications at different clock frequencies? • Earlier work suggests there will much variation • User Study • 8 users • 3 frequencies + Windows XP DVFS • 3 typical Windows apps • Presentation, Animation, Game • Rate comfort on Leikert-like 1 to 10 scale
Presentation • Dramatic variation in user satisfaction for fixed frequencies • And for DVFS • Setting frequency for worse case user is pessimistic • Setting it for an “average” user is also wrong Game
User-Driven Frequency Scaling (UDFS) • Developed system to dynamically customize frequency to the individual user • Key idea: user feedback at run-time • User presses “irritation button” (F11) as input • But not too often! • 2 very simple learning algorithms • UDFS1, UDFS2
UDFS2 Algorithm • Goal: probe to find the lowest frequency level the user is comfortable at and stabilize there • General idea: react additivelyto both passage of time and user irritation events; also update rate of reaction based on rate of user feedback • UDSF1, in contrast, is an additive increase/multiplicative decrease algorithm, analogous to TCP Reno congestion control
UDFS2 Algorithm • Each frequency level rihas interval ti • ti = 10 seconds, initially • ri are frequencies in descending order • User not irritated in current interval ti ? • Switch frequency to ri+1 , interval ti+1 • Let’s go slower in the next interval
UDFS2 Algorithm • User irritated in current interval ti ? • ti-1 = a ti-1 (a>1) • We should spend more time at the next highest frequency • tk = b tk " k: k¹i-1 (b<1) • We should spend less time at the other frequencies, including this one • Switch frequency to ri-1 , interval ti-1 • a = 2.5, b=0.8 in our studies
UDFS2 in Action(User is playing a game) Note Convergence
Outline • Summary • User-Driven frequency scaling (UDFS) • User pessimism study • UDFS2 algorithm • Process-Driven voltage scaling (PDVS) • PDVS profiling • Evaluation of UDFS and PDVS • Work in context • Conclusion
CPU Voltage • Minimum voltage needed for CPU stability is a function of frequency and temperature • Claim: function varies across individual parts for many interesting processors • Hence, we can do better than the worst case (nominal) function • P µ V2CF makes even small changes significant
Example This processor can be run at lower voltages than specifications indicate 2.13 GHz Pentium M-770 in a Thinkpad T43p
Process-Driven Voltage Scaling • Profiling System (Boot CD) • Workload generator • Temperature monitor • Frequency selector • Voltage selector • Watchdog timer • For each frequency/temperature • Modulate workload to maintain temperature • Decrease voltage until watchdog timer fires and reboots machine • Profiling system implemented by Nikolay Valtchanov and Matt Robben Profile: min_voltage(frequency, temperature) Any DVFS Scheme
Outline • Summary • User-Driven frequency scaling (UDFS) • User pessimism study • UDFS2 algorithm • Process-Driven voltage scaling (PDVS) • PDVS profiling • Evaluation of UDFS and PDVS • Work in context • Conclusion
Experimental Setup • IBM Thinkpad T43p • 2.13 GHz Pentium M-770 • 1 GB RAM • Windows XP SP2 • UDFS system (or Windows DVFS) runs online, adjusting CPU frequency as user interacts with the system and applications • PDVS effects and power measurements/analysis are done offline, using logs from UDFS and user traces • System power measurement • CPU dynamic power via simulation
Application Tasks • Use Microsoft Powerpoint 2003 to replicate a presentation while listening to background music with Windows Media Player 10 • Watch 3D Shockwave animation with Microsoft Internet Explorer (locally stored animation) • Play FIFA 2005 Soccer (first person shooter game)
Users • 20 participants recruited from Northwestern population via IRB-approved methods • Participants self-identified as “Power User”, “Typical User”, “Beginner” for each application, plus PCs and Windows • A demographic mix
Study Process • Fill out a questionnaire (2 minutes) • Read a one page handout (2 minutes) • Acclimatize to the performance of our machine by using the apps (5 minutes) • Perform the following tasks for UDFS1 • Powerpoint (4 minutes) • 3D Shockwave (4 minutes) • FIFA game (8 minutes) • Repeat previous for UDFS2
ResultsCompared to Windows DVFS Unless Otherwise Noted • Measured system power • UDFS1, UDFS2, UDFS1+PDVS, UDFS2+PDVS, Windows DVFS+PDVS • Simulated CPU dynamic power • UDFS1, UDFS2, UDFS1+PDVS, UDFS2+PDVS, Windows DVFS+PDVS • Measured mean and peak temperature • UDFS1, UDFS2, UDFS1+PDVS, UDFS2+PDVS • User irritation event rate (UDFS1,2) • Multitasking study
Measured System Power(PowerPoint, % improvement over Windows DVFS) PDVS dominates gains for less interactive applications with little user-user variance
Measured System Power(FIFA, % improvement over Windows DVFS) UDFS contributes significant gains for more interactive applications
Measured Temperature(PowerPoint) Significant temperature reductions are possible using UDFS and PDVS
Measured Temperature(FIFA Game) Significant temperature reductions are possible using UDFS and PDVS
User Irritation Button Presses Rate of user feedback can be low, and can decrease with time First 4 minutes Second 4 minutes
Outline • Summary • User-Driven frequency scaling (UDFS) • User pessimism study • UDFS2 algorithm • Process-Driven voltage scaling (PDVS) • PDVS profiling • Evaluation of UDFS and PDVS • Work in context • Conclusion
Work In Context of Power Management Efforts in the Empathic Systems Project (empathicsystems.org) • A. Gupta, B. Lin, P. Dinda, Measuring And Understanding User Comfort With Resource Borrowing, HPDC 2004 • Opportunity paper: Identification of variance in user satisfaction with systems decisions • P. Dinda, G. Memik, R. Dick, B. Lin, A. Mallik, A. Gupta, S. Rossoff, The User In Experimental Computer Systems Research, ExpCS 2007 • Position paper: overview of goals of project and advocacy for user-driven work • A. Mallik, J. Cosgrove, R. Dick, G. Memik, P. Dinda, PICSEL: Measuring User-Perceived Performance to Control Dynamic Frequency Scaling, ASPLOS 2008 • Customize power management to user by observing output to him • A. Shye, B. Ozisikyilmaz, A. Mallik, G. Memik, P. Dinda, R. Dick, A. Choudhary, Learning and Leveraging the Relationship between Architectural-level Measurements and Individual User Satisfaction, ISCA 2008 • Learn performance counter->user satisfaction and use in power management • A. Shye, Y. Pan, B. Scholbrock, J. S. Miller, G. Memik, P. Dinda, R. Dick, Power to the People: Leveraging Human Physiological Traits to Control Microprocessor Frequency, MICRO 2008 • Measure user satisfaction using biometrics and use in power management • [This paper] • Direct user feedback for power management + PDVS
Related Work • DVFS in general • Gochman, et al [Intel Tech Journal], Broch, et al [SOC03], and many more… • Dynamic Thermal Management • Liu, et al [IEEE JSSC-93], Brookes, et al [WCED00], Crusoe, Intel Pentium-M, etc… • PDVS-related • Teodorescu, et al [ISCA08], Razor [Ernst, et al, MICRO03], Dhar, et al [ISLPED05], Intel Foxton, AutoDVS [EMSOFT05], etc… • UDFS-related • Lorch, et al [UCB TR], Yan, et al [DAC05], Vertigo [OSDI02], Xu, et al [EMSOFT05], Ranga, et al [IEEE Computer-06], Anand, et al [MOBICOMM03], Theocharous, et al [Intel Tech Journal 06]
Conclusion • User-Driven Frequency Scaling (UDFS) • Adjust CPU frequency according to satisfaction of individual user, exploiting variation in satisfaction among users • Process-Driven Voltage Scaling (PDVS) • Adjust voltage at frequency and temperature based on profile of the individual processor, exploiting variation among processors • ~50% power reduction on Windows tasks compared to Windows DVFS • User study, measured system power • Variation is opportunity
For MoreInformation • Empathic Systems Project • http://empathicsystems.org • Prescience Lab • http://presciencelab.org • Peter Dinda • http://pdinda.org
Measured System Power(Multitasking Study, % improvement over Windows DVFS)) Multitasking appears to increase benefits Small additional study where user watched 3D animation while also listening to MP3s using Windows Media Player
Measured System Power(3D Shockwave, % improvement over Windows DVFS) UDFS contributes significant gains for more interactive applications
Measured Temperature(3D Shockwave) Significant temperature reductions are possible using UDFS and PDVS