Download
1 / 10
100 likes | 106 Vues
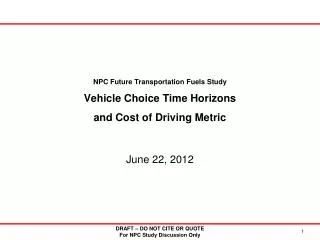
NPC Future Transportation Fuels Study Vehicle Choice Time Horizons and Cost of Driving Metric. June 22, 2012. Time Horizons - Introduction. The NPC Study used two time horizons 3-year baseline approach 17-year sensitivity study

E N D
NPC Future Transportation Fuels StudyVehicle Choice Time Horizonsand Cost of Driving Metric June 22, 2012 DRAFT – DO NOT CITE OR QUOTE For NPC Study Discussion Only
Time Horizons - Introduction • The NPC Study used two time horizons • 3-year baseline approach • 17-year sensitivity study • These time horizons are implicit in the Vehicle Choice Model in the relative weighting of vehicle purchase price (Retail Price Equivalent) and vehicle operating fuel costs • These time horizons are a key criteria in the Vehicle Attribute Model for choosing the design tradeoff point between vehicle price and fuel economy • These time horizons do not change the Cost of Driving metric computation. This metric is a fleet characteristic, with all vehicles in the fleet having a common survival rate and a common mileage profile over their lifetimes, regardless of design and purchase criteria • The use of these time horizons and their effect on cost of driving are illustrated on the following slides DRAFT – DO NOT CITE OR QUOTEFor NPC Study Discussion Only
A Tale of Two Buyers • Joe – the 3-year buyer • Joe has just graduated and needs a new vehicle as he starts his new job • He has student loans to repay and has not established a credit history. Dealers are willing to offer him financing on his new vehicle, but he will be required to pay the full loan in 36 monthly payments over 3 years • This puts Joe in a cash crunch. He will be living paycheck to paycheck during these first three years until pays off his new vehicle • Once he’s paid off his vehicle, he intends to own it for its expected lifetime of 17 years, so his cash flow situation will be greatly improved in years 4 through 17 • The auto industry understands Joe’s situation and has equipped each vehicle offering to minimize the sum of his expected payments over the first three years of ownership • This equates to minimizing the net present value (NPV) of the vehicle purchase price plus 3 years of expected fuel expenditure • Future fuel expenditures are discounted at 8% real cost of money • Since there is no way of knowing with any confidence what future fuel prices will be, the fuel price at the time of purchase is the assumed fuel price for the first 3 years DRAFT – DO NOT CITE OR QUOTEFor NPC Study Discussion Only
A Tale of Two Buyers Joe’s Cash Flow Model and NPV of Expected Payments cash flow crunch minimize this point: NPV of vehicle purchase price + 3 years of expected fuel expenditure … to minimize expected cash flow during the crunch period … and don’t worry about fuel expenditures in years 4-17 ~ free cash flow ~ DRAFT – DO NOT CITE OR QUOTEFor NPC Study Discussion Only
A Tale of Two Buyers • Sally – the 17-year buyer • Sally is well established in her career and has decided it’s time to buy a new vehicle • She has a positive net worth and a high rate of savings. She plans to pay cash for her new vehicle • She intends to own her new vehicle for its expected lifetime of 17 years, so her purchase decision is based on lifetime value. She would like to minimize her cost per mile over the ownership period • The auto industry understands Sally’s purchase criteria and has equipped each vehicle offering to minimize the expected lifetime ownership costs • This equates to minimizing the net present value (NPV) of the vehicle purchase price plus 17 years of expected fuel expenditure • Future fuel expenditures are discounted at 8% real cost of money • Since there is no way of knowing with any confidence what future fuel prices will be, the fuel price at the time of purchase is the assumed fuel price for the full 17 years of ownership DRAFT – DO NOT CITE OR QUOTEFor NPC Study Discussion Only
A Tale of Two Buyers Sally’s Cash Flow Model and NPV of Expected Payments ~ ~ $23,775 paid in month one for vehicle purchase + fuel Joe’s NPV of Cumulative Payments line for reference minimize this point: NPV of vehicle purchase price + 17 years of expected fuel expenditure … to minimize expected lifetime $/mile cost on an NPV basis … and cash flow profile is not a factor ~ DRAFT – DO NOT CITE OR QUOTEFor NPC Study Discussion Only
3-year vs. 17-year Vehicle Choice Modeling Approach • In the baseline modeling approach, all buyers use Joe’s purchase criteria, and all vehicles are offered with technology options that minimize the net present value of the expected payments over the first 3 years of ownership • Vehicles with a low purchase price will capture greater market share • Fuel expenditures are a small part of the total payments over the first three years, so technologies that improve fuel economy must be very cost-effective to be selected as vehicle options 3-year • In the sensitivity modeling approach, all buyers use Sally’s purchase criteria, and all vehicles are offered with technology options that minimize the net present value of the expected payments over the vehicle lifetime of 17 years • Fuel expenditures, even when discounted over time, are a significant part of total lifetime payments, so a greater degree of technologies that improve fuel economy are selected as vehicle options 17-year DRAFT – DO NOT CITE OR QUOTEFor NPC Study Discussion Only
Fleet Cost of Driving Metric • Vehicle + Fuel costs on a $/mile basis • The fleet Cost of Driving metric shares key assumptions with the Vehicle Choice Model • Real cost of money is 8% - this is used to amortize the vehicle price over its lifetime mileage schedule • Same expected annual mileage as a function of vehicle age • The fleet Cost of Driving metric differs from the Vehicle Choice Model in that • It applies a survival rate. Not all vehicles remain on the road for their expected life • It sums over all vehicles in operation in a given year; it does not quantify the cost of driving a single vehicle over multiple years • It uses projected fuel prices for each year, rather than assuming that the fuel price at time of purchase is the fuel price over the entire vehicle lifetime DRAFT – DO NOT CITE OR QUOTEFor NPC Study Discussion Only
Back to the Two Buyers • Plotted below are the projected Vehicle $/mile and the Vehicle + Fuel $/mile costs over time for Joe’s vehicle and Sally’s vehicle • The Cost of Driving metric averages these costs with all other vehicles on the road for a given year Joe’s fuel economy is lower than Sally’s, so he has a higher Vehicle + Fuel cost of driving unless fuel prices drop very low Joe’s 2020 Vehicle + Fuel cost of driving averages $0.318 / mile The 3-year fleet 2020 cost of driving is the average of 300 million or so of these data points from on-road vehicles that were purchased using Joe’s purchase criteria Sally’s Vehicle cost is $0.213 / mile Joe’s Vehicle cost is $0.197 / mile Sally’s 2020 Vehicle + Fuel cost of driving averages $0.310 / mile The 17-year fleet 2020 cost of driving is the average of 300 million or so of these data points from on-road vehicles that were purchased using Sally’s purchase criteria DRAFT – DO NOT CITE OR QUOTEFor NPC Study Discussion Only
Time Horizons - Summary • The 3-year and 17-year time horizons reflect two different criteria for weighting of vehicle attributes in the vehicle purchase consideration • Once the vehicle purchase criteria are assumed, each vehicle is optimized with the technology option set that makes it most attractive to the consumer under those criteria • New vehicle shares from the Vehicle Choice Model drive the composition of the modeled vehicle fleet • The vehicle fleet Cost of Driving metric is computed in the same manner in all cases • The mix and attributes of vehicles in the fleet will differ depending on whether 3-year or 17-year criteria were applied to their design optimization and modeled consumer purchase decisions • but the cost of driving for a given vehicle in a given year is computed by amortizing the vehicle over its lifetime miles and adding the fuel cost per mile, independent of the time horizon basis of vehicle purchase DRAFT – DO NOT CITE OR QUOTEFor NPC Study Discussion Only