Download
1 / 100
1k likes | 1.12k Vues
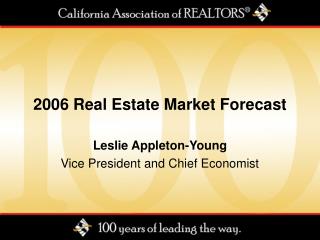
2006 Real Estate Market Forecast. Leslie Appleton-Young Vice President and Chief Economist. Overview. Economic Conditions California Housing Market California Commercial Market Regional Real Estate Markets Southern California Bay Area Central Valley 2006 Forecast. Economic Conditions.

E N D
2006 Real Estate Market Forecast Leslie Appleton-Young Vice President and Chief Economist
Overview • Economic Conditions • California Housing Market • California Commercial Market • Regional Real Estate Markets • Southern California • Bay Area • Central Valley • 2006 Forecast
Gross Domestic Product • 2004: 4.2% 2005 3.4% 2006 3.6% ANNUAL PERCENT CHANGE, CHAIN-TYPE (2000) $
Hurricane Katrina • Will dampen growth in the short-term but does not pose a more persistent threat to the economy • GDP will lose .5% in 2005 Q3,1% in 2005 Q4 • Higher energy prices will cost consumers $50 Billion • $25B in insurance payments and $??? B in Government Aid sent to region • Budget deficit will increase $10 B this year; $10-15B next year; more in 2007+
Consumer Price Index • Inflation August 2005: 3.6% Y-T-Y; 2.2% Core PERCENT CHANGE FROM A YEAR AGO
Crude Oil Prices Dollars per Barrel of West Texas Intermediate, Adjusted by CPI (1982-84=100, SA)
Employment Growth, California vs. U.S. YEAR TO YEAR % CHANGE
Nonfarm Employment By Region SOURCE: CA Employment Development Division
Consumer Confidence Index • August 2005: 103.2 INDEX, 100=1985
Personal Consumption • 2005 Q2: +3.0% QUARTERLY PERCENT CHANGE
US Sales and Median Price ANNUAL RATE
Mortgage Origination Refinance vs. Purchase ORIGINATION (BIL $) 30-YR FIXED RATE MORTGAGE SOURCE: Mortgage Bankers Association Source: Mortgage Bankers Association of America
Mortgage Origination • Refinance Share vs. Purchase Share REFINANCE/PURCHASE SHARE 30- YR FIXED RATE MORTGAGE SOURCE: Mortgage Bankers Association Source: Mortgage Bankers Association of America
Home Prices, Mortgage Rates and Consumer Spending • Over $200 B per year in spending power has been added from the growth of borrowing against rising home prices. • Home equity loans increase from $552 Billion in 2001 to $881 Billion in 2004 • Home equity cash out refis grew from $92 Billion 1996-1999 to $400 Billion 2002-2004 • This borrowing has fueled consumer spending and it will slow as housing price gains moderate.
Fed Funds and Mortgage Rates • 2000-2005 SOURCE: Federal Home Loan Mortgage Corp.
Why are Rates so Low? Greenspan: It’s a “Conundrum” • Deflationary Structural Forces • Global Competition: Wal-Mart Effect • Increased consumer Awareness: Internet Effect • Productivity gains/Greater efficiency • Global Labor force – off-shoring • Foreign Central Banks and Pension funds holding more $’s
ARMs as a Percent of All MortgagesWhy isn’t this lower? Source: Federal Housing Finance Board Source: Federal Housing Finance Board
New Loan Products and Risk • Types of instruments • Zero down-payment • Interest-only • Stated income • Option-ARM’s • Concerns • Ability to absorb rate adjustments • Slower equity growth ahead
National Economy • Economic growth in 2006 a moderate 3.6% • The “Goldilocks Economy”? • Accompanied by … • Modest job growth – solid but not outstanding • Inflation in check – Fed Priority • Continued strength in Business Investment • Consumer Spending flat • Growing Fiscal Stimulus: Katrina • Strong Housing Market slightly off 2005 peak
California’s Housing Cycles and Membership1970-2006 THOUSANDS
Sales of Existing Detached Homes and Pacific West Consumer Confidence • California, July 2005 Sales: 647,913 Units, Up 3.3% Y-T-D, Up 1.3% Y-T-Y UNITS INDEX SOURCE: California Association of REALTORS®; The Conference Board
Median Price of Existing Detached Homes • California, July 2005: $540,900, Up 17.1% Y-T-Y SOURCE: California Association of REALTORS®
California’s Million-Dollar Home Sales YEAR NUMBER OF HOMES Source: DataQuick Information Systems
Unsold Inventory Index • California - July 2005 : 3.2 months of supply MONTHS SOURCE: California Association of REALTORS®
Sales Index vs. Listings Index 1989 = 100 LR Average Listings = 1.5 times sales
Why are Home Prices Rising? Econ 101 • Strong Demand • Low Mortgage Rates • Demographics: Baby Boomers • Flight from alternative investment choices • Speculation? • Restricted Supply • Constraints on new construction • Low inventory of homes for sale
Is There a Housing Bubble? Yes Virginia, there is a bubble – a bubble in the number of articles about the housing bubble.
BUBBLE? NO! SOFT LANDING? YES
What is a Bubble?NASDAQ 1987-2005 MONTHLY AVERAGE
Median Price, Annual Percentage Change • California vs. U.S. ANNUAL PERCENTAGE CHANGE
California Median Price 1970-2005 • Annual Percentage Change ANNUAL PERCENTAGE CHANGE
Annual Housing Market Survey 2005-2006: Market in Transition
Median Price Discount And Weeks On Market Q. What was the original list sales price of the property? What was the final sales price of the property? How many weeks did the property remain on the MLS?
Median Net Cash To Sellers Q. What was the net cash gain or net loss to the seller as a result of this sale?
Type of Residence Q. What type of residence was purchased? Note: Figures do not total 100% due to “other” types of homes sold.
Proportion of First-Time Homebuyers (Single-Family Detached vs. Condo/Townhome) Q. Was the buyer a first-time buyer?
Proportion of First-Time HomebuyersCalifornia Q. Was the buyer a first-time buyer?
Median DownpaymentFirst-Time Homebuyers Vs. Repeat Homebuyer Q. What was the amount of downpayment?
Median DownpaymentSingle-Family Detached Vs. Condo/Townhomes Q. What was the amount of downpayment?
Proportion of Transactions With Second Mortgages Q. In addition to the first mortgage or assumption, was there a second mortgage?
Housing Affordability Index • California Vs. U.S. % OF HOUSEHOLDS THAT CAN BUY SOURCE: California Association of REALTORS®
California vs. U.S. Median Prices • 1970-2004 SOURCE: California Association of REALTORS®
California vs. U.S. Household Income • 1980 - 2004 CURRENT DOLLARS SOURCE: U.S. Census Bureau, CA Dept of Finance
Sources of Population Growth • California 1981-2004 THOUSANDS SOURCE: CA Dept. of Finance