9.6 Exponential Growth & Decay Models
70 likes | 301 Vues
9.6 Exponential Growth & Decay Models. Today, when we do our examples, we will be doing “Speaker and Scribe” Get with a partner. Give them your calculator For every question, only one person is touching the calculator When it’s your turn to be the speaker,

9.6 Exponential Growth & Decay Models
E N D
Presentation Transcript
Today, when we do our examples, we will be doing “Speaker and Scribe” Get with a partner. Give them your calculator For every question, only one person is touching the calculator When it’s your turn to be the speaker, You tell the scribe EXACTLY which buttons to push NO touching your calculator and NO POINTING USE YOUR WORDS!!!
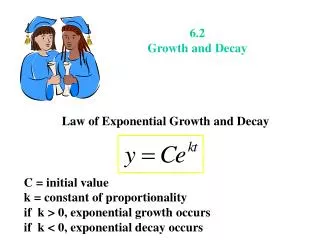
We will use our knowledge & skills to solve real world problems using exponential & logarithmic equations. How we enter the numbers in our calculators is VITAL! WATCH THOSE PARENTHESES!! Here is a sampling of the types of equations you may encounter. (Example of Growth Curve) Populations: P = P0ert Ex 1) The population of a culture of bacteria grew exponentially from 200 to 2300 in 18 hours. a) Find the average growth rate of the population of this culture and determine an equation of the population growth curve for this culture. P0 = original population r = rate • t = time • P = P0ert • 2300 = 200er(18) • 11.5 = e18r • ln 11.5 = 18rlne ln 11.5 18 r ≈ 13.6% = r • P = 200e0.136t
Assuming a constant growth rate, predict the population to the nearest hundred after 24 hours. • P = 200e0.136t • P = 200e0.136(24) • P = 5200 • (Example of Modified Growth Curve) • Ex 2) A new sandwich shop has just opened on Los Al Blvd. near Rossmoor, which has a population of 8200 people. The store has no budget to advertise. Previous experience in other towns has shown that the number of people who have heard of this store by word-of-mouth after t weeks can be modeled by N = Nf (1 – e–0.09t) where Nf is the fixed population. Determine the number of people, to the nearest hundred, who will have heard of the shop after 1 month, and then 6 weeks, and then 3 months. = 4 weeks = 12 weeks 1 month N = 8200(1 – e–0.09(4)) N = 2500 6 weeks N = 8200(1 – e–0.09(6)) N = 3400 3 months N = 8200(1 – e–0.09(12)) N = 5400
(Example of Decay Curve) A common decay model is for half-life: Carbon-14 dating half-life is 5570 years Ex 3) A fossil found at an archeological dig has 74 mg of carbon-14. If it originally contained 150 mg, use the carbon-14 dating formula to determine its age. t = time h = half-life t ≈ 5678 years
(Example of Modified Decay Curve) • Newton’s Law of Cooling: Tf = Tr + (T0 – Tr)e–rt • Tf = final temp • Tr = temp of surrounding air • T0 = original temp • r = rate object is cooling • Ex 4) The cooling model for tea served in a 6 oz cup has a rate of 0.41. If the original temp of the tea was 200°F and the room temp is 68°F, determine after how many minutes the tea will be 85°F. t = 5 min
Homework #907 Pg 478 #1, 2, 5, 7, 9, 10, 12, 15, 16, 18, 22, 25, 27, 32