The Storm Surge Toolkit
290 likes | 577 Vues
The Storm Surge Toolkit. Jamie Rhome Storm Surge Specialist/Team Lead National Hurricane Center. Forecasting Surge. All storm surge models are STRONGLY dependent on the accuracy of the meteorological input!!!

The Storm Surge Toolkit
E N D
Presentation Transcript
The Storm Surge Toolkit Jamie Rhome Storm Surge Specialist/Team LeadNational Hurricane Center
Forecasting Surge • All storm surge models are STRONGLY dependent on the accuracy of the meteorological input!!! • Meteorological uncertainty will dominate over storm surge model specifications (physics, resolution, etc) • Different vertical datums/reference levels • Storm surge is only one component in the real water level rise. • Total water rise = surge + tides + waves + freshwater flow
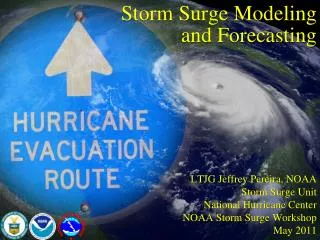
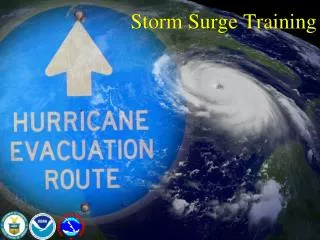
SLOSH • Sea, Lake, and Overland Surges from Hurricanes • A computerized numerical model developed by the National Weather Service (NWS) to estimate storm surge heights (and winds) resulting from historical, hypothetical, or predicted hurricanes
ADCIRC & SLOSH • Overall flooding pattern very similar
NHC TRACK ERROR 12 hr. OUT 133 mph, 933 mb. Hurricane Advisory – Approximately 12 hr. before landfall
Rmax=25 mi (forecast) Surge Based on NHC -12 hr. Advisory
ACTUAL TRACK TRACK FORECAST 133 mph, 933 mb. Actual Hurricane Track 30 mi. E of -12 hr. Advisory Forecast Track
Rmax=40 mi Surge Based on NHC Storm Best Track
Ensemble: run a given model or models with varying conditions Different directions of motion Different landfall locations Different intensities Different storm sizes Different forward speeds Different tide levels For example, NHC uses between 2000-4000 individual SLOSH simulations to create operational guidance in real-time. SLOSH MOMs require 10,000-15,000 individual simulations to fully map the storm surge threat for a given area. Alternative to Single Runs
MEOWs (Maximum Envelope of Water) MOMs (Maximum of Maximums) P-Surge (Probabilistic Surge) Ensemble Products
MEOW Maximum Envelope Of Water
Maximum Envelope Of Water • User selects: • Category (Cat 3) • Landfall direction (wnw) • Forward speed (15 mph) • Initial tide (High)
Maximum Envelope Of Water • User selects: • Category (Cat 3) • Landfall direction (wnw) • Forward speed (15 mph) • Initial tide (High)
Maximum Envelope Of Water • User selects: • Category (Cat 3) • Landfall direction (wnw) • Forward speed (15 mph) • Initial tide (High)
Maximum Envelope Of Water • User selects: • Category (Cat 3) • Landfall direction (wnw) • Forward speed (15 mph) • Initial tide (High)
MOM Maximum Of the MEOWs
MOM • User selects: • Category (Cat 3)
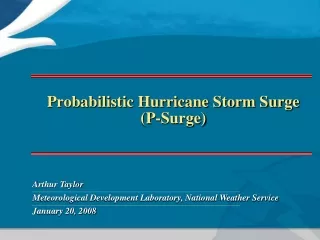
Probabilistic Storm Surge • Use an ensemble of SLOSH runs to create probabilistic storm surge (p-surge) • Intended to be used operationally so it is based on NHC’s official advisory • P-surge’s ensemble perturbations are determined by statistics of past performance of the advisories • P-surge uses a representative storm for each portion of the error distribution space rather than a random sampling
When is it Available? • Whenever a hurricane watch or warning is in effect • Available about 30 minutes after the advisory release time
Deterministic SLOSH run shows limited surge threat to Pensacola area Rmax=25 mi (forecast) Surge Based on NHC -12 hr. Advisory
Probabilistic product shows considerable surge threat to Pensacola area
Tier 1 Response < 48 h of landfall Tier 2 Readiness 48 h – 120 h of landfall Tier 3 Planning/Mitigation > 120 h of landfall Surge Guidance Timeframe NHC Storm Surge Product Decision Support Wedge
Height Above Ground Level (Inundation)
New Surge Statement Storm surge flooding of 2 to 4 feet above normal tide levels ... Can be expected along the west coast of Florida in areas of onshore flow south of Venice and in Florida Bay. Storm surge should begin to decrease along the east coast of Florida. STORM SURGE WILL RAISE WATER LEVELS BY AS MUCH AS 4 FEET ABOVE GROUND LEVEL ALONG THE WEST COAST OF FLORIDA IN AREAS OF ONSHORE FLOW SOUTH OF VENICE AND IN FLORIDA BAY ... WITH LARGE AND DANGEROUS BATTERING WAVES ... THE SURGE COULD PENETRATE AS FAR INLAND AS ABOUT 10 MILES FROM THE SHORE WITH DEPTH GENERALLY DECREASING AS THE WATER MOVES INLAND. STORM SURGE SHOULD BEGIN TO DECREASE ALONG THE EAST COAST OF FLORIDA.