Download
1 / 24
240 likes | 337 Vues
This research explores classifying census areas using K-means clustering on demographic, housing, socioeconomic data. Learn about clustering methods, variables standardization, and interpretation of results. The study covers the challenges of determining the number of clusters, algorithm applications to different area types. Discover classification themes like Blue Collar Communities, City Living, and more. Explore insights into cluster distinctions and potential applications.

E N D
Using K-means Clustering to Classify Census Areas ESRC Research Methods Festival 2008 Dan Vickers RCUK Academic Fellow Department of Geography, University of Sheffield www.sheff.ac.uk/sasi www.areaclassification.org.uk
Classifying areas using census data • Output Areas are the smallest area for general census output. • 223,060 in the UK • England & Wales • Number of OAs: 174,434 • Min size: 40 households, 100 people • Mean size: 124 households, 297 people • Scotland • Number of OAs: 42,604 • Min size: 20 households, 50 people • Mean size: 52 households, 119 people • Northern Ireland • Number of OAs: 5,022 • Min size: 40 households, 100 people • Mean size: 125 households, 336 people
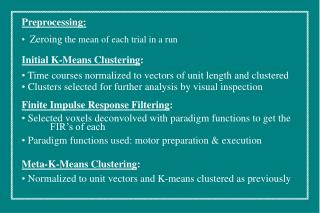
Seven Steps of Cluster Analysis • Clustering elements/objects • Clustering variables • Variable standardisation • Measure of association (Proximity measure) • Clustering method • Number of clusters • Interpretation, testing and replication Adapted from Milligan 1996
Classifying areas using census data • 41 Census Variables covering: • Demographic attributes • Including - age, ethnicity, country of birth and population density • Household composition • Including - living arrangements, family type and family size. • Housing characteristics • Including - tenure , type & size, and quality/overcrowding • Socio-economic traits • Including - education, socio-economic class, car ownership & commuting and health & care. • Employment attributes • Including - level of economic activity and employment class type. • 223,060 Output Areas, 41 Variables = 9,145,460 data points
Classifying areas using census data • Log Transformation • Reduce the effect of extreme values • Range Standardisation (0-1) • Problems will occur if there are differing scales or magnitudes among the variables. In general, variables with larger values and greater variation will have more impact on the final similarity measure. It is necessary therefore to make each variable equally represented in the distance measure by standardising the data.
Classifying areas using census data • When choosing the number of clusters to have in the classification there were three main issues which need to be considered. • Issue 1: Analysis of average distance from cluster centres for each cluster number option. The ideal solution would be the number of clusters which gives smallest average distance from the cluster centre across all clusters. • Issue 2: Analysis of cluster size homogeneity for each cluster number option. It would be useful, where possible, to have clusters of as similar size as possible in terms of the number of members within each. • Issue 3: The number of clusters produced should be as close to the perceived ideal as possible. This means that the number of clusters needs to be of a size that is useful for further analysis.
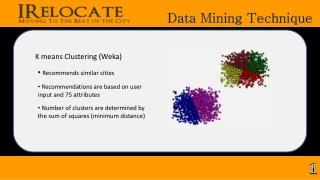
Classifying areas using census data • K-means clustering • K-means is an iterative relocation algorithm based on an error sum of squares measure. The basic operation of the algorithm is to move a case from one cluster to another to see if the move would improve the sum of squared deviations within each cluster (Aldenderfer and Blashfield, 1984). • The case will then be assigned/re-allocated to the cluster to which it brings the greatest improvement. The next iteration occurs when all the cases have been processed. A stable classification is therefore reached when no moves occur during a complete iteration of the data. After clustering is complete, it is then possible to examine the means of each cluster for each dimension (variable) in order to assess the distinctiveness of the clusters (Everitt et al., 2001).
Classifying areas using census data 1: Blue Collar Communities
Classifying areas using census data 2: City Living
Classifying areas using census data 3: Countryside
Classifying areas using census data 4: Prospering Suburbs
Classifying areas using census data 5: Constrained by Circumstances
Classifying areas using census data 6: Typical Traits
Classifying areas using census data 7:Multicultural
Low Council Tax Band High Data for Sheffield only
You may like to Read • Everitt, B. S., Landau, S. and Leese, M. (2001), Cluster Analysis 4th Ed. London, Arnold. • Gordon, A. D. (1999), Classification 2nd Ed., London, Chapman and Hall. • Milligan, G. W. (1996), Clustering validation: Results and implications for applied analyses, in Arabie, P., Hubert, L. J. and De Soete, G. Eds., Clustering and Classification, Singapore, World Scientific. • Kaufman, L. and Rousseeuw, P. J. (2005), Finding Groups in Data, Chichester, Wiley. • Vickers, D. and Rees, P. (2006), Introducing the National Classification of Census Output Areas, Population Trends,125, p15-29. • Vickers, D. and Rees, P. (2007). Creating the National Statistics 2001 Output Area Classification, Journal of the Royal Statistical Society, Series A 170(2).