Graphical Representation of Data: Understanding Variables and Basic Statistics
Learn about variables, basic statistics terminologies, and different graphical representations for data analysis. Explore examples and types of charts like bar charts, pie charts, histograms, and line charts.

Graphical Representation of Data: Understanding Variables and Basic Statistics
E N D
Presentation Transcript
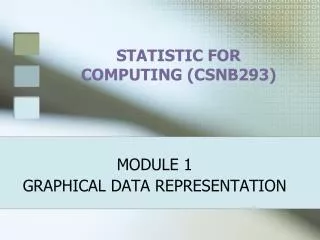
STATISTIC FOR COMPUTING (CSNB293) MODULE 1 GRAPHICAL DATA REPRESENTATION
Variables • A variableis a characteristic that may changes under different circumstances • Examples: • Hair color – varies between individuals • White blood cell count – varies between individuals • Class schedule – varies between courses • Time to failure of a computer component – varies between different computers • Transmission error rate – varies between different types of transmission cables, length of cable segment
Basic Statistics Terminologies • An experimental unit The individual or object on which a variable is measured. • A measurement The results when a variable is actually measured on an experimental unit • A population a set of entities concerning which statistical inferences are to be drawn • A sample A sub-set of entities drawn from the overall population
Graphical Data Representations • Data can be represented using graphs / charts. • The choice of graph / chart is very much dependent on the nature of data. • A single variable measured for different population segments can be graphed using a pie or bar chart. • A histogram can be used to illustrate several variables measured for different population segment. • A single variable measured over time is called a time series. It can be graphed using a line or bar chart.
Bar Chart Vs. Pie Chart Bar Chart Pie Chart
Histogram Histogram
Line Chart CONSUMER PRICE INDEX Line Chart
Line Chart Vs. Bar Chart LINE CHART BARCHART
4 5 6 7 Dotplots • Plots the measurements as points on a horizontal axis, stacking the points that duplicate existing points. • Example: The set 4, 5, 5, 7, 6
Stem and Leaf Plots • Divide each measurement into two parts: the stem and the leaf. • List the stems in a column, with a vertical line to their right. • For each measurement, record the leaf portion in the same row as its matching stem. • Order the leaves from lowest to highest in each stem. • Provide a key to your coding
4 0 5 6 0 5 5 5 8 8 7 0 0 0 0 0 0 4 5 5 8 9 0 5 4 0 5 6 5 8 0 8 5 5 7 0 0 0 5 0 4 0 5 0 8 9 0 5 Reorder Example of Stem and Leaf Plots The prices ($) of 18 brands of walking shoes: 90 70 70 70 75 70 65 68 60 74 70 95 75 70 68 65 40 65
Interpreting Graphs: Location & Spread Where is the data centered on the horizontal axis, and how does it spread out from the center?
Mound shaped and symmetric(mirror images) Skewed right: a few unusually large measurements Skewed left: a few unusually small measurements Bimodal: two local peaks Interpreting Graphs: Shapes
No Outliers Outlier Interpreting Graphs: Outliers • Are there any strange or unusual measurements that stand out in the data set?
Example of Interpreting Graphs: Outliers • A quality control process measures the diameter of a gear being made by a machine (cm). The technician records 15 diameters, but inadvertently makes a typing mistake on the second entry. 1.991 1.891 1.991 1.988 1.993 1.989 1.990 1.988 1.988 1.993 1.991 1.989 1.989 1.993 1.990 1.994
STATISTIC FOR COMPUTING(CSNB293) GRAPHICAL DATA REPRESENTATION --END--