Download
1 / 18
180 likes | 334 Vues
Lab experiments on phyllosilicates and comparison with CRISM data of Mars. Mario Parente, Janice L. Bishop and Javier Cuadros. Outline. Observation 1: diversity in clay spectroscopy in the NIR not mirrored by equal diversity in visible range

E N D
Lab experiments on phyllosilicates and comparison with CRISM data of Mars Mario Parente, Janice L. Bishop and Javier Cuadros
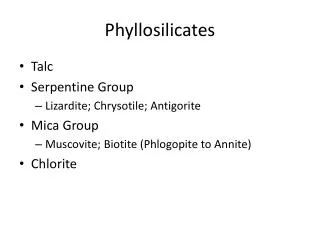
Outline • Observation 1: diversity in clay spectroscopy in the NIR not mirrored by equal diversity in visible range • Hypothesis: dust coating and mixtures dust / clays • Observation 2: the ferrous slope of Mawrth Vallis • Hypothesis: hydrothermal alteration of glass into smectite as a possible spectroscopic evidence for slope • Comparison with CRISM • Conclusions
Phyllosilicate diversity in VNIR • In CRISM images, we detect different clays using Metal-OH bands near 2.2 µm (Al-smectite, blue) and 2.3 µm (Fe/Mg-smectite, red) • In Mawth Vallis, phyllosilicates often accompanied by hydrated silica (opal and amorphous Al/SiOH) ~ green • also detected using 2.2 µm band depth Ferrous phase + Fe/Mg-smectite ~ yellow
Little spectral variation in the visible range Lab spectra of montmorillonite and nontronite show differences in metal-OH band positions (2.2 vs 2.3 µm) + variation in the extended visible region due to Fe electronic transitions in the nontronite. CRISM spectra of Mawrth Vallis (from McKeown et al 2008) show variation in metal-OH bands but almost identical spectra from 0.4 to 1.2 µm
Little spectral variation in the visible range • Further investigation showed subtle differences in the position of the peak near 0.7-0.8 µm
Dust coating experiments • We simulated dust deposition by sprinkling progressively increasing amounts of dust on top of nontronite and montmorillonite rocks using a spatula. • We measured the spectra from 0.3 to 2.5 mm of the rock surfaces and the rocks with different amounts of both nanophase ferrihydrate dust and fine-grained Haleakala ash on a black Teflon dish using an ASD spectrometer under ambient conditions. • In order to qualitatively assess the amount of dust present on the rocks, we captured images of the samples with a microscope at multiple magnifications after dust deposition
Nontronite with Haleakala coating Number of stars represents level of dust. Effect on NIR region is minimal. Significant and gradually increasing attenuation of absorptions near 600 and 900 nm. Position of nontronite peak near 780 nm shifts only slightly. 7
Nontronite with Ferrihydrate coating • Effect on NIR region is minimal. • Significant attenuation of absorption near 600 nm. • Position of nontronite peak near 780 nm does not shift
Montmorillonite with Haleakala coating • Primary effect of Haleakala ash coating is darkening of the spectra. • Haleakala coating produces change in slope between 500 and 700 nm and a slight shift of the montmorillonite peak around 800 nm • Note- montmorillonite has strong bands due to adsorbed water.
Montmorillonite with Ferrihydrate coating • Dominance of ferrihydrite coating in visible region. • Slight shift of montmorillonite peak towards longer WL • Note- montmorillonite has strong bands due to adsorbed water.
Comparing coatings with mixtures • Fine-grained mixture of nontronite and ferrihydrate (prepared by Alicia Muirhead). • In both coating and mixture we observe the dominating effect of the iron-oxide before 0.7 µm
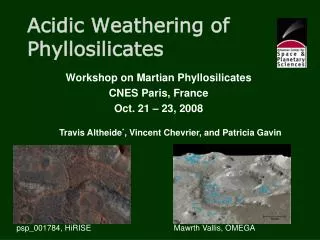
The ferrous component in spectra of Mawrth Vallis • Ferrous slope observed at transition from nontronite to Al-clay/hydrated silica layers. • Likely to be mica (could also be carbonate, sulfate, olivine). • Extremely unusual on Earth without microbes. • On Mars implies active aqueous chemistry: • Rapid input of Fe2+ into system that converted to mineral quickly before Fe could be oxidized. • Closed system where Fe3+ in nontronite was reduced by unknown source at upper boundary.
The ferrous component in the spectra of Mawrth Vallis • Fe/Mg-smectite found in phyllosilicate deposits at lower elevations. • OH bands indicate FeMg-OH in octahedral layers. • Fe2+ slope typically observed at boundaries of Fe/Mg-smectite deposit. • Red is Fe/Mg smectite (Fe3+) • Green is ferrous phase (Fe2+) • Blue is Al-phyllosilicate and/or hydrated silica 43EC CRISM image 43EC draped over MOLA with 20X vertical enhancement
Alteration of volcanic glass: spectral features • De la Fuente, Cuadros et al., explored hydrothermal alteration as possible scenario for formation of smectites and preservation of ferrous features. • The study used volcanic tuff samples primarily composed of rhyolitic glass and were exposed to hydrothermal alteration in the lab at temperatures ranging from 60 to 160 C for up to a year • Most prominent effect of abundant smectite present in the matrix is a shift in Fe band position from 1.1 µm towards shorter WL. • Ferrous slope in spectra of these sample is less than that observed at Mawrth Vallis; however, other ferrous-bearing glasses may have a stronger ferrous absorption.
Alteration of volcanic glass: spectral features • The alteration does not affect the spectrum before 0.7 µm • The band center near 1.1µm shifts towards lower WL for more smectite formed 15
Direct comparison with CRISM • CRISM spectra have the band around 1.2 µm removed • We compare with selected spectra from the studies described in the previous slides
Direct comparison with CRISM (close-up) Subtle changes observed in extended visible region (max near 0.8 and min near 1 µm) for montmorillonite and nontronite rocks implying changes in Fe mineralogy with these clay minerals. The concave feature near 0.5 µm is better explainred by the presence of iron oxides The band minimum around 1.0 µm could be due to a mixture 17
Conclusions • Coatings: only a few grains of ferrihydrate or altered volcanic ash coating a rock surface are sufficient to alter the spectral properties of the rock in the visible region. At the same time these coatings have only a minor effect on the glass bands from 1.9 to 2.5. • Mixtures: fine grains of nontronite mixed with ferrihydrite show only a hint of 0.6 µm nontronite shoulder with 10% ferrihydrite (work by REU intern Alicia Muirhead). • Chemical alteration: hydrothermally altered ferrous glass mixed with phyllosilicates in rocks could account for the presence of the ~ 1 μm band in the clay units at Mawrth Vallis • There are possibly multiple causes of the spectral features observed