Download
1 / 43
440 likes | 604 Vues
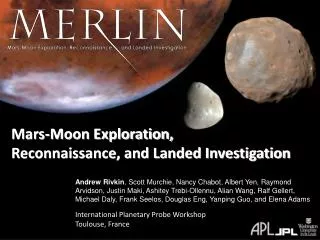
Reconnaissance Imaging Spectrometer for Mars CRISM Data Analysis. Presenter Mr. Kaiem Frink M.S. Co-Author: Dr. Hayden Elizabeth City State University Department of Mathematics and Computer Science. Overview. Introduction Literature Review Methodology Background Data Process Results

E N D
Reconnaissance Imaging Spectrometer for Mars CRISM Data Analysis PresenterMr. Kaiem Frink M.S.Co-Author: Dr. HaydenElizabeth City State UniversityDepartment of Mathematics and Computer Science
Overview • Introduction • Literature Review • Methodology • Background • Data Process • Results • Educational Outreach
CRISM Intro The Compact Reconnaissance Imaging Spectrometer for Mars CRISM (CRISM) carried aboard the Mars Reconnaissance Orbiter (MRO), is the first visible-infrared spectrometer to fly on a NASA Mars mission. CRISM scientists are using the instrument to look for the residue of minerals that form in the presence of water: the 'fingerprints' left by evaporated hot springs, thermal vents, lakes or ponds. With unprecedented clarity, CRISM is mapping regions on the Martian surface at scales as small as 60 feet (about 18 meters) across, when the spacecraft is 186 miles (300 kilometers) above the planet. CRISM is reading 544 'colors' in reflected sunlight to detect certain minerals on the surface, including signature traces of past water. CRISM alone will generate more than 10 terabytes of data, enough to fill more than 15,000 compact discs.
CRISM Intro Cont. Given that quantity of data being returned by MRO-CRISM, this project partners with Johns Hopkins University (JHU) Applied Physics Laboratory (APL) scientists of the CRISM team to assist in the data analysis process. The CRISM operations team has prototyped and will provide the necessary software analysis tools. In addition, the CRISM operations team will provide reduced data volume representations of the data as PNG files, accessible via a web interface without recourse to specialized user tools. The web interface allows me to recommend repeating certain of the CRISM observations as survey results indicate, and to enter notes on the features present in the images.
Literature Review • Research Methods R.L.Mosley 1934 • Signal and Image Processing L. Henry 1974 • www.cerser.edu • http://crism-map.jhuapl.edu • * Gilbert, L. R.,1, Magdy, W.,, Gad, E., Q., Gamal, El.,A., Ado, D.,-I., Happy., S., Khomotso, K., Souleymane, F., Joseph, Q.,, Akilah, M., Bereket, A.,, Chetan, M.,, Kaiem, F., Jean P., A., (2008) "Overcoming Bandwidth and Satellite Communications Limitations to Accelerate Applications of Remote Sensing and High Performance Computing for African Development: Contributions from Egypt, Nigeria and South Africa“ • * Malcom, L., Linda, H., Kaiem.L., F., (2009) Reconnaissance Imaging Spectrometer for Mars CRISM Data nalysis • * Kaiem L. F., Gilbert L. R., Larry, B., Larry T., Cliff,. R., (2008) Interdisciplinary Geosciences Research • Martin, H., Greg, O., John, E., (2009) International Journal of Mathematical Education in Science and Technology • Federal Register Presidential Documents Executive Order 12906 (1994) [FRPDEO] • Rob, .R, Jet (2008) Propulsion Laboratory, NASA/Pasadena, CA SWEET 2.0: Moving Toward Community-Based Ontologies • Branch, B. D., Jr. (2008) A Study of Educators’ Perceptions of Spatial Thinking • Margo, A. M., (2000) The Inclusive Classroom Strategies for Effective Instruction • Robert, K., (2009) NEWSFOCUS U.S. HIGHER EDUCATION Minority Retention Rates in Science Are Sore Spot for Most Universities • 10-Lay, S. R., (1986) Analysis: With an Introduction to Proof
Literature Review Cont. • Nevin, Tom. “Africa’s new challenge: crossing the digital divide,” African Business, IC Publications, London, pp. 24-27. June, 2002. • Chinn, Menzie D. and Robert W. Fairlie “The determinants of the global digital divide: a cross-country analysis of computer and internet penetration,” Oxford Economic Papers, Oxford University Press, Cambridge, UK, Vol. 59, No. 1, pp. 16-44, 2007. • Fuchs, Christian and Eva Horak. “Africa and the digital divide,” Telematics and Informatics, Elsevier, Amsterdam, The Netherlands,Vol. 25, Issue 2, May 2008, pp. 99-116. • Mutula, Stephen M. “Cyber Café Industry in Africa,” Journal of Information Science, Sage Journals, Los Angeles, CA, Vol. 29, No. 6, 2003, pp. 489-497. • Stoney, William E., ASPRS guide to land imaging satellites Mitretek Systems, McLean, VA, Nov. 8, 2004, updated. • Byte and Switch Newsfeed, March 28, 2008 http://www.byteandswitch.com/document.asp?doc_id=149469 • Seagal, Aaron. “Appropriate Technology: The African Experience,” African and Asian Studies, Brill Publishers, Leiden, The Netherlands, Vol. 27, Nos. 1-2, 1992, pp. 124-133. • Jensen, Mike. “Making the Connection: Africa and the Internet,” Current History. Current History, Inc., Philadelphia, PA, Vol. 99, No. 637, pp. 215-220, May, 2000. • PriMetrica, Inc. Internet Map. TeleGeography Research, Washington, DC, 2004. • Rochon, Gilbert L. "Food Security, Public Health and Sustainable Development: Participation of U.S. Agencies and the United Nations in Remote Sensing & GIS in Africa," GIS IN GOVERNMENT: The Federal Perspective, 1994 - Proceedings of the First Federal Geographic Technology Conference. Sept. 26-28, 1994, Washington, DC. GIS World Books, 1995.
Literature Review Cont. • G. L. Rochon, D. Szlag, F.B. Daniel, and C. Chifos. “Remote Sensing Applications for Sustainable Watershed Management and Food Security,” in Gerard Begni, Editor, Observing our Environment from Space: New Solutions for a New Millennium. Lisse, The Netherlands: A.A. Balkema Publishers, 2002 • Gilbert L. Rochon, Chris Johannsen, David Landgrebe, Bernard Engel, Jonathan Harbor, Sarada Majumder and Larry Biehl. “Intergenerationaly Prudent Resource Management in Africa: The Contributions of Remote Sensing & Spatial Technologies in Achieving Sustainability,” IEEE International Geoscience and Remote Sensing Symposium (IGARSS 2003). Presented in Toulouse, France, July, 2003. • Joseph E. Quansah, Gilbert L. Rochon, Kwamena K. Quagraine, Steve Amisah, Mucai Muchiri and Charles Ngugi. “Remote Sensing Applications for Sustainable Aquaculture in Africa,” Institute for Electrical Engineering & Electronics (IEEE) International Geoscience & Remote Sensing Symposium (IGARSS). Barcelona, Spain, July 23-27, 2007. IEEE Proceedings No. 1-4244-1212-9/07, pp. 1255-1259. • Gilbert Rochon, Butare Rukundo, Joseph Quansah and Mohamed A. Mohamed. “Remote Sensing for Sustainable Public Health & Infectious Disease Mitigation in Africa,” UN Global Earth Observing System of Systems (GEOSS) Workshop. Ouagadougou, Burkina Faso, Sept. 16-18, 2007 • Mbarika, Victor W. A. “Rethinking Information and Communications Technology Policy Focus on Internet versus Teledensity Diffusion for Africa’s least Developed Countries,” Electronic Journal of Information Systems in Developing Countries, Omaha, University of Nebraska and City University of Hong Kong. Vol. 9, No. 1, pp. 1-13, 2002.
Collaborators Provided via online website http://crism.jhuapl.edu/ Manage by • NASA • APL • JPL, • JHU, • University of Washington in St. Louis
CRISM Web graphical user interface methodology 1st of 3 images
Methodology cont. 2nd of 3 GUI The following image displays the CRISM graphical user interface (GUI) with observation details .
Five additional layers Images NASA/Johns Hopkins University Applied Physics Laboratory
Interpretations • Window 1: is labeled "vnir_fem" Which stands for "very near infrared channel to record iron minerals" (Fe is the chemical symbol for iron) structure in this window may indicate the presence of oxidized iron minerals. Water oxidizes iron and so this would be a possible indicator of a history of the presence of water at this site. • Window 2: is labeled "ir_maf" Which stands for "infrared channel to record mafic mineralogy" Structure in this window may indicate the presence of magnesium-iron rich minerals. Magnesium-Ferric or to use the accepted contraction: mafic minerals, may indicate a history of water rich volcanic activity on the Martian surface. • Window 3: is labeled "ir_phy" Which stands for "infrared channel to record phylosilicate (clay) minerals." Structure in this window may indicate the presence of clay or clay-like minerals, which may be a possible indicator of a history of the presence of water at this site. • Window 4: is labeled "ir_hyd" Which stands for "very near infrared channel to record hydrated minerals" Structure in this window • Window 5: is labeled "ir_ice" Which stands for "infrared channel to record ice." Structure in this window may indicate the presence of ice which of course
Window 1: is labeled "vnir_fem" • Which stands for "very near infrared channel to record iron minerals" (Fe is the chemical symbol for iron) structure in this window may indicate the presence of oxidized iron minerals. Water oxidizes iron and so this would be a possible indicator of a history of the presence of water at this site. Images NASA/Johns Hopkins University Applied Physics Laboratory
Window 2: is labeled "ir_maf" • Which stands for "infrared channel to record mafic mineralogy" Structure in this window may indicate the presence of magnesium-iron rich minerals. Magnesium-Ferric or to use the accepted contraction: mafic minerals, may indicate a history of water rich volcanic activity on the Martian surface. Images NASA/Johns Hopkins University Applied Physics Laboratory
Window 3: is labeled "ir_phy" • Which stands for "infrared channel to record phylosilicate (clay) minerals." Structure in this window may indicate the presence of clay or clay-like minerals, which may be a possible indicator of a history of the presence of water at this site. Images NASA/Johns Hopkins University Applied Physics Laboratory
Images NASA/Johns Hopkins University Applied Physics Laboratory Window 4: is labeled "ir_hyd" Which stands for "very near infrared channel to record hydrated minerals" Structure in this window may indicate the presence of hydrated minerals. Water can be present as a molecularly bound component of minerals. Minerals with molecularly bounded water are called hydrates. Typically this water can be driven out of (or separated from) the mineral hydrate by subjecting them to very high temperatures (Much higher than the 0 degree C melting point of water ice, like about 500 degrees C). Hydrates are yet another possible indicator of water being present during the mineralization processes at a site.
Window 5: is labeled "ir_ice" • Which stands for "infrared channel to record ice." Structure in this window may indicate the presence of ice which of course is just frozen water. Frozen water ice could be a future propellant, energy or life support resource for human missions to Mars or an indicator of the presence of (sub-surface?) micro-environments more benign than the Martian surface. It may also be an indicator of high potential for life. Images NASA/Johns Hopkins University Applied Physics Laboratory
Images NASA/Johns Hopkins University Applied Physics Laboratory
Data Set The following image displays the CRISM data set beginning at numerical value two.
Data Set End The following image displays the CRISM data set ending at numerical value 1606.
Future Research • A few questions and or concerns for the data providers? • Can plants grow on Mars? • Long term impacts on the human body while being space ? • There has never been a reported space death ? • Can women become pregnant in space ? • Why is the Sensor ID not included within with URL web address ? • Why is the solar longitude not included within with URL web address ? • What is the significance of the Center latitude and Center longitude ? • Implement a Mathematical algorithm that can identify sequences in image analysis ? • Within the table observation details the correlation of the meta data? • Within the dataset what is HRS, FRT, HRL indicating? • File • HRL00007E20_07_IF181L_TRR2.LBL • What is TRR2.LBL?
Educational OutreachBroader Impact Within the Center of Excellence in Remote Sensing Education and Research we have primary focus on the next generation of Scientist and exposing students to these types of opportunities is one form out outreach that’s fun and interesting. • Engage K-12 students Purpose: to strengthen the science community • Remote Sensing Techniques • Climate Change • Computer Familiarity • Hardware and Software • High Performance Computing • Inform local community of ice sheet, coastal, ocean, and marine research.
Local News Paper Press • Daily Advanced 2010 • ECSU Magazine • GPS Technology • “Gifted and Talented Students Impacted by the Digital Divide”SPED 660 Professor: Dr. ViltzInternational Video Conference University of Witwatersrand • This project has been published 10 times. • Seven out of the ten times has been peer reviewed journals or confrences.
North Carolina Space Grant First Elizabeth City State Univeristy student to receive this NASA funded Fellowship.
ACCEPTED FOR PUBLICATION American Geophysical Union 2009
National GIS DAY http://nia.ecsu.edu/ur/1011/101117gis/gisday.html
References Online Sources • JPLhttp://crism-map.jhuapl.edu • CERSER www.cerser.edu Literature Review • Murchie, S. L, et al. (2002) LPS XXXIII, 1697. • MEPAG, Mars Exploration Program:Scientific Goals, Objectives, and Priorities,2000. • Research Methods R.L.Mosley 1934 • Signal and Image Processing L. Henry 1974
Acknowledgements • Audience • IGARSS 2011 • CERSER- Center of Excellence in Remote Sensing Education and ResearchPrincipal Investgator Dr. Hayden • Elizabeth City State University • NSF National Science Foundation • Funding agencies • NASA, • Partner Insitutions APL, JPL, JHU, University of Washington in St. Louis
Delete This Slide • As of May 9th 2011, I will be officially searching the job market. With a Masters of Mathematics so please do not offer all of your positions at once.
Contact Information E-Mail: Kaiem_frink@hotmail.comWebsite: www.kaiemfrink.com Thank You for your time. Questions The floor is open for questions.