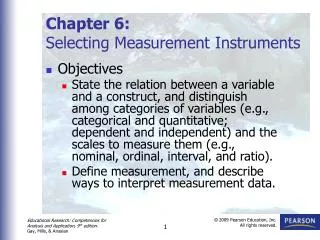
SELECTION OF MEASUREMENT INSTRUMENTS
570 likes | 1.8k Vues
SELECTION OF MEASUREMENT INSTRUMENTS. Administer a standardized instrument Administer a self developed instrument Record naturally available data (GPA, absenteeism rates) Measure physical performance data. 3 WAYS TO COLLECT DATA. Validity.

SELECTION OF MEASUREMENT INSTRUMENTS
E N D
Presentation Transcript
SELECTION OF MEASUREMENTINSTRUMENTS • Administer a standardized instrument • Administer a self developed instrument • Record naturally available data (GPA, absenteeism rates) • Measure physical performance data 3 WAYS TO COLLECT DATA
Validity The degree that a test measures what it is supposed to measure. Valid for what? Valid for whom?
Types of Validity Content validity The test measures the intended content Item validity: Sampling validity: Face (logical) validity: Test items measure intended content Test samples content adequately Test appears to measure what is supposed to
Who Determines Validity? NO SET TEST! Researcher determines validity by making a comparison about what should be included and what is included!
Types of Validity • Construct validity The test measures the intended hypothetical construct Construct- a non-observable trait RATE OF LEARNING INTELLIGENCE RPE ANXIETY
Types of Validity • Concurrent validity Scores on your test are related to scores on a previously administered test e.g. , judges ratings and tournament results Steps • Administer a VO2Max test • Administer a treadmill walking test • Correlate the two sets of test scores • Evaluate the results • If correlation is high, VO2Max can be substituted
Types of Validity • PREDICTIVE VALIDITY Test predicts how well an individual will perform in the future Examples Predictive validity of GRE for graduate study Prediction of NTE scores and success as a teacher Prediction of population who will become obese
To Determine Predictive Validity Steps • Administer the gre • Wait until first year gpa is established • Correlate two sets of test scores • Evaluate the results • Determine validity coefficient Interpretation Scores range from 0 to 1 Higher score is better
Reliability • Consistency of test measurement • High test reliability means that when the test is retaken, the same scores would be earned • Reliability ranges from 0 to 1
How do validity and reliability relate? A valid test is always reliable A reliable test is not always valid Tests with high reliability may not measure what is intended by the researcher
Errors in the test Failure to follow procedures Student fatigue Inattention to detail Ambiguous questions Familiarity with the test Unclear directions Improper administration Student mood Why do tests have low reliability?
Test-Retest Reliability Scores are consistent over time Steps • 1. Administer test to group • 2. Administer test again after time has • Passed (1 or 2 weeks) • 3. Correlate 2 sets of scores Coefficient of Stability
Alternate Forms Reliability Test A and Test B measure the same traits Steps 1. Administer one test form 2. Administer second form to the same group 3. Correlate 2 sets of scores Coefficient of Equivalence
Split-half Reliability Requires only one administration of the test Steps • 1. Administer the total test to group • 2. Divide test into 2 comparable halves (odd • or even questions) • 3. Compute a set of scores for each half • 4. Correlate 2 sets of scores • 5. Apply Spearman-Brown correction COEFFICIENT OF EQUIVALENCE
2r split half r = 1 + rsplit half 2 x (.80) 1.60 r = 1.00 + .80 1.80 Spearman-Brown example Spearman-Brown correction- used to predict reliability from 25 item to 50 item test SPLIT-HALF RELIABILITY = O.80 = = .89
Rationale Equivalence Reliability Requires only one administration of the test Steps • 1. Administer the total test to group • 2. Divide test into 2 comparable halves (odd • or even questions) • 3. Compute a set of scores for each half • 4. Correlate 2 sets of scores • 5. Apply Spearman-Brown correction COEFFICIENT OF EQUIVALENCE
External Reliability Researcher status Choice of subjects Social situations and conditions Analytic constructs Methods of data collection and analysis Internal Reliability Inter-observer agreement All team members trained the same way All team members treat subjects identically For videotape and transcript analysis reliability is established before the experiment begins Internal and External Reliability
Scorer/rater Reliability Occurs when subjective scoring of test items is performed Inter-judge reliability - 2 or more scorers rate the tests the same way Intra-judge reliability - same scorer rates each test the same way
Reliability Coefficients The closer to 1.0 the better Achievement/aptitude tests – reliability should not be less than 0.9 Subtest reliability should be calculated for tests that have more than one component
SEm = SD 1 - r Standard Error of Measurement Used to express test reliability Small standard error of measurement (SEM) indicates high reliability Interpreted similarly to standard deviaton
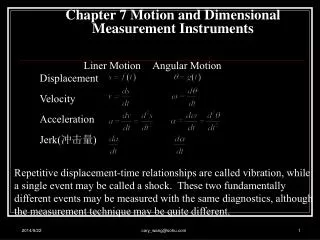
Four types of measurement scales • Nominal- subjects grouped based on gender, race, fitness level • Ordinal- rank comparisons, rank tallest to shortest • Interval- supply the order and the distance between sets of scores (used with standard scores) • Ratio-used when there are no zero points, IQ of 160 is not twice as smart as an IQ of 80…
Z scores M = 0, SD = 1.0 Used to compare and contrast 2 different test scores e.g, push-up and 40 yard dash T scores M = 50, SD = 10 Converts Z scores to all positive measures Standard Scores
Measuring Affective Behavior • Personality • Anxiety • Self-esteem • Social Behavior • RPEs Hey, look no hands.
High point values on a positive statement indicate A positive attitude. SEMANTIC DIFFERENTIAL __ __ __ __ __ __ __ NECESSARY UNNECESSARY 3 2 1 0 -3 -2 -1 __ __ __ __ __ __ __ FAIR UNFAIR POSITIVE NEGATIVE Types of Scales LIKERT
Personality Tests • Non-projective - uses a self-report instrument • Inventory - yes/no questions • Scale - used to determine what an individual feels or believes • May not be accurate due to societal influences