Download
1 / 24
240 likes | 389 Vues
PHOTOCHEMICAL MODELING TO ATTRIBUTING SOURCE AND SOURCE REGIONS TO OZONE EXCEEDANCES IN SPAIN. M.T. Pay 1,* , V. Valverde 1 , J.M. Baldasano 1,2 , R. Kwok 3 , S. Napelenok 3 , K. Baker 4 1 Earth Sciences Department , Barcelona Supercomputing Center, Barcelona, Spain

E N D
PHOTOCHEMICAL MODELING TO ATTRIBUTING SOURCE AND SOURCE REGIONS TO OZONE EXCEEDANCES IN SPAIN M.T. Pay1,*, V. Valverde1, J.M. Baldasano1,2, R. Kwok3, S. Napelenok3, K. Baker4 1Earth SciencesDepartment, Barcelona Supercomputing Center, Barcelona, Spain 2Environmental Modeling Laboratory, Technical University of Catalonia, Barcelona, Spain 3ORD/NERL/AMAD, U.S. EPA, Research Triangle Park, NC 4OAQPS, U.S. EPA, Research Triangle Park, NC *now at: Laboratoire de MétéorologieDynamique, ÉcolePolytechnique, PalaiseauCedex, France 13th Annual CMAS Conference, Chapel Hill, NC, October 27-29, 2014
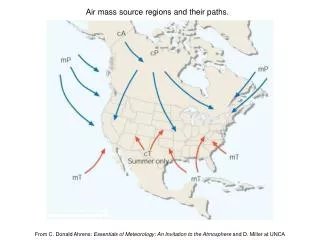
The problem of O3 in Europe & Spain Emission trend in Europe (EEA, 2013a) • O3 precursors emissions have declined (27% for NOx and 28% NMVOC) • High O3 (rural background), PM and NO2 (urban areas) concentrations are still a problem. • Discrepancy: increasing inter-continental transport of O3 and its precursors. Air pollution by O3 in Europe (EEA, 2013b) LTO exceedances in summer 2012 • Exceedances TV (21%), LTO (85%), IT (28%) and AT (3%) summer 2012. • Regions: Medit. area > Central & E EU > NW EU > N EU LTO: Long-Term Objective TV: Target Value IT: Information Threshold AT: Alert Threshold
Management of the O3 problem: Source Apportionment • Objective: Quantify the origin (sources and regions) of O3 in Spain during a summer episode affecting Europe: • - contribution from global, regional, local scales. • - contribution from main anthropogenic sources in Spain. Ground-level O3 concentrations are a result of the long-range transport, the stratospheric intrusions and local photochemical production from biogenic and anthropogenic VOC and NOxprecursors. To develop efficient policies to mitigate O3 exceedances, it is important to understand the sources of precursors that contribute to exceed the O3limit values. Source Apportionment (SA) approaches are useful for national/regional/local authorities who have to developed cost-efficient emissions control strategies because they allow to identify the relative importance of sources that contribute to high O3 concentrations.
ISAM: the Integrated Source Apportionment Method • ISAM: augmented version of CMAQv5.0.2 (AERO6, CB05) • ISAM for Particulate Matter Source Apportionment: • Applied over USA, evaluated by means brute force zero-out scenarios (Kwok et al., 2013) • ISAM for O3 Source Apportionment: • Applied over USA, evaluated by means brute force zero-out scenarios(Kwok et al., 2014) • Based on O3 SA from CAMx-OSAT. • Hybrid approach: using the PH2O2/PHNO3 indicator ratio. • Tracers to represent NOx and VOC families are based on CB05 individual species contributing to O3formation: • VOC (14 tracer): ALD2, ALDX, ETH, ETHA, ETOH, FORM, IOLE, ISOP, MEOH, OLE, PAR, TERP, TOL, XYL • Nitrogen compounds (9 tracers): NO, NO2, NO3, N2O5, HONO, PAN, PANX, PNA, NTR.
Model configuration and setup: Spanish air quality forecast system (www.bsc.es/caliope) NO2 emissions (kg/h) EU12 (12 km x 12 km) IP4 (4 km x 4 km) HERMES model = Guevara et al., 2014
O3 SA to track contribution:regions ISAM-EU12 (Europe, 12 km x 12 km) EU12 • Goal: to quantify contribution of sources out side/from Spain to O3 • EURO: countries surrounding Spain* • ESP: Spain* • OTHR: Ocean • BCON: Interpolation from MACC (global O3 transport out from EU12) Spain* (Spanish IP + Balearic Islands)
O3 SA to track contribution:regions | main emission sources ISAM-EU12 (Europe, 12 km x 12 km) EU12 • Goal: to quantify contribution of sources out side/from Spain to O3 • EURO: countries surrounding Spain* • ESP: Spain* • OTHR: Ocean • BCON: Interpolation from MACC (global O3 transport out from EU12) IP4 Spain* (Spanish IP + Balearic Islands) HERMES model (2009) ISAM-IP4 (Iberian Peninsula, 4 km x 4 km) CMAQ-ISAM-IP4 NOx NMVOC • Goal: to quantify contribution of main Spanish emissions sources to O3 • OTHR: other sectors • SNAP1: combustion in energy • SNAP34: non- and industrial combustion • SNAP7: road transport • SNAP8: other mobile source & agricultural machinery • BCON: nesting CMAQ-EU12 Bio (68%) Agri (12%) Solvents (10%)
Study episode: 21-31 July 2012 21-24th = ITL 25-29th = Nwad 30-31st = ITL ITL • The largest O3 episode in 2012 (24-28th July): • 33% of the total number of exceedances of the IT, • 32% of the total number of exceedances of the AT, • 12% of the number of exceedances of the LTO. L NWAd H L MSL P & prep H Temp & wind ITL: Iberian Thermal Low NWad: NW advection
Region contribution to O3 in Spain (EU12):Mean concentration 21-31 July 2012 EURO ESP TOTAL OTHER BCON
Region contribution to O3 in Spain (EU12):NO2/O3 hourly concentration LTO O3 EURO = 40 µg/m3 mean, 60 µm/m3 during the peak NO2 NWad NO2-BCON NO2-EURO NO2-ESP NO2-OTHR
Region contribution to O3 in Spain (EU12):Rural background sites LTO LTO EURO controls EURO controls LTO LTO Portugal controls ESP controls LTO LTO ESP controls Portugal + ESP + Shipping controls
Source contribution to O3 in Spain (IP4):Mean concentration 21-31 July 2012 SNAP34 SNAP1 TOTAL SNAP8 SNAP7 BCON OTHR
Source contribution to O3 in Spain (IP4):Traffic in Madrid MAD MAD O3- MAD city O3- downwind MAD city LTO LTO NO2- MAD city NO2- downwind MAD city
Source contribution to O3 in Spain (IP4):Shipping over southern Spain 2 1 4 3 - 1 - 2 LTO LTO SNAP8 = 14-18 µg/m3 SNAP8 = 18-24 µg/m3 - 3 - 4 LTO LTO SNAP8 = 24-30 µg/m3 SNAP8 = 14-18 µg/m3
Summary of SA: regions and emissions sources ISAM-EU12 ISAM-IP4 13% OCEAN ≈ SNAP8 20% ESP ≈ 10% SNAP7 + 6% OTHR + 3% SNAP1 + 3% SNAP34 64% non-ESP ≈ 20% EURO + 44% global 1% ICON
Conclusions and future work • The O3 problem in Spain is not only local(20%), but continental, hemispheric and global (64%). • NWadbrings O3 and precursors from N EU countries and international shipping inland Spain up to 60 µg/m3 (~40-50 µg/m3) in N Spain; meanwhile central and costal areas are more affected by recirculation of local precursors. • High influence of the international shipping (13%), affecting costal areas, and southern Spain (Strait of Gibraltar): 14-24 µg/m3, up to 30 µg/m3. • The road traffic (10%) has the highest contribution at stations downwind big cites (10-15 µg/m3 the whole cycle), meanwhile at urban stations the contribution is only during rush hour. • The sector combustion in energy (3%) and industrial and non-industrial combustion (3%) has a low mean contribution 2-4µg/m3over Spain, maximum of 4-6 µg/m3 near NOx-limited areas (W IP). • ISAM is useful as a diagnostic tool: • Overestimation of chemical boundary condition in the western domain of EU. • To test the performance emissions model, to revise station categories • The ISAM quantifies the required days to spinup the model was at least 6, ICON < 10%. • Together with source sensitivity approach (e.g., CMAQ-DDM or adjoin) allows to take more cost-efficient mitigation options.
Thank you for your attention References: • EEA, 2013a. Air quality in Europe – 2013 report. European Environmental Agency, EEA Report, No 9/2013. ISSN 1725-9177. 112 pp. • EEA, 2013b. Air pollution by ozone across Europe during summer 2012. Overview of exceedances of EC ozone threshold values for April-September 2012. European Environmental Agency, EEA Report, No 3/2013. ISSN 1725-2237. 52 pp. • Guevara, M., Pay, M.T., Martinez, F., Soret, A., van der Gon, H., Baldasano, J.M., 2014. Inter-comparison between HERMESv2.0 and TNO-MACC-II emission data using the CALIOPE air quality system (Spain). • Kwok, R., Baker, K., Napelenok, S., Tonnesen, G., 2014. Photochemical grid model implementation of VOC, NOx, and O3 source apportionment. Geoscientific Model Development Discussions 7, 5791-5829. • Kwok, R., Napelenok, S., Baker, K., 2013. Implementation and evaluation of PM2.5 source contribution analysis in a photochemical model. Atmospheric Environment 80, 398-407. • Valverde, V., Pay, M.T., Baldasano, J.M., 2014. Circulation-type classification derived on a climatic basis to study air quality dynamics over the Iberian Peninsula. International Journal of Climatology, doi: 10.1002/joc.4179 Webs: • Air Quality Forecasts Europe / Spain: http://www.bsc.es/caliope Acknowledgments: • CMAS Visiting Scientist programme: Dr.Adel Hanna (UNC) and Dr.RohitMathur(USEPA) Funding: BeatriuPinósprogramme (2011 BP-A 427), SeveroOchoa (SEV-2011 00067)
Contribution from combustion | industrial areas 1 2 3 4 - 1 - 2 LTO LTO - 3 - 4 LTO LTO
Contribution of traffic in main cities | Barcelona BCN BCN - MAD - MAD - BCN - BCN recirculation