Download
1 / 21
210 likes | 425 Vues
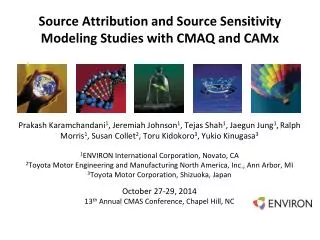
Source Attribution and Source Sensitivity Modeling Studies with CMAQ and CAMx. Prakash Karamchandani 1 , Jeremiah Johnson 1 , Tejas Shah 1 , Jaegun Jung 1 , Ralph Morris 1 , Susan Collet 2 , Toru Kidokoro 3 , Yukio Kinugasa 3 1 ENVIRON International Corporation, Novato, CA

E N D
Source Attribution and Source Sensitivity Modeling Studies with CMAQ and CAMx Prakash Karamchandani1, Jeremiah Johnson1, Tejas Shah1, Jaegun Jung1,Ralph Morris1, Susan Collet2, Toru Kidokoro3, Yukio Kinugasa3 1ENVIRON International Corporation, Novato, CA 2Toyota Motor Engineering and Manufacturing North America, Inc., Ann Arbor, MI 3Toyota Motor Corporation, Shizuoka, Japan October 27-29, 2014 13thAnnual CMAS Conference, Chapel Hill, NC
Acknowledgement • This study was supported by Toyota Engineering and Manufacturing (TEMA) , North America and Toyota Motor Corporation (TMC), Japan
Study Objectives • Determine source category contributions to future year air quality • On-road mobile emissions (and sub-categories of on-road emissions) • Off-road emissions • Emissions from stationary sources (point, area) • Natural emissions (biogenic, wild fire) • Global contributions (boundary conditions) • Compare various approaches to determine source contributions and sensitivities: • Different models (CMAQ vs CAMx): Brute force method (BFM) • CAMx source attribution probing tools: OSAT for ozone and PSAT for PM2.5 • CAMx source sensitivity probing tool: HDDM for ozone • Calculate source category impacts on future year design values • Determine future year population exposures in non-attainment areas
Study Components • Model performance evaluation for 2008 base year (CMAQ, CAMx) • Future year (2018, 2030) simulations (CMAQ, CAMx) with zero-out for relevant source categories • Future year CAMx OSAT and PSAT simulations • Future year CAMx-HDDM simulations and CAMx BFM simulations with 20% emission reductions • Analysis of results
Approach • Phased approach • Initial studies considered limited simulation periods (1 month in winter and 1 month in summer) • Understand differences in results predicted using various modeling tools • Latest study (ongoing) focuses on annual simulations with selected CAMx probing tools
Modeling Domains • Nested Grid • 36 km resolution CONUS • 12 km resolution inner grids • Model Inputs • Base year (2008) WRF meteorology • Base and future year (2018 and 2030) emissions • MOVES and EMFAC2007 used to adjust future year on-road mobile emissions for Tier 3/LEV III impacts • 36 km BCs from MOZART • MEGAN for biogenic emissions
Summary of 1-Month Simulation Studies Years: 2008 (Base), 2018 & 2030 (Future),Months: January (PM), July (O3, PM)
Future Year CMAQ Daily Max 8-hour O3 and Change in Daily Max • Western US
Future Year CMAQ Daily Max 8-hour O3 and Change in Daily Max • Eastern US
O3 2008 DVCs and Future Year DVFs • - 2030 DVFs < 75 ppb, except for 8 counties in CA • - 2030 DVFs < 70 ppb, except for 15 counties in CA and 1 county each in CO & MD 120 SB, RS CA LACA 100 CMAQ 80 75 70 Ozone DV ppb 60 2008 DVB 2018 DVF 40 2030 DVF 20 0 SC PA MD CA AL NY MI WY GA • X axis:Alphabetical Order, States => Counties
O3 Non-Attainment Area Populations • More areas reach attainment in future years, resulting in lower population exposure 19.7 59.2 2008 58.9 20.7 18.4 20.9 CMAQ 2018 CAMx 18.8 21.0 11.4 11.5 2030 13.3 14.2 0 20 40 60 80 Millions of People
Comparison of Approaches Source Attribution: OSAT vs Zero-Out Source Sensitivity: HDDM vsBFM
CMAQ vs CAMx Zero-Out: 2030 Max O3 On-Road Mobile Contributions • Western US • Eastern US CMAQ CMAQ CAMx CAMx
CAMx Zero-Out vs OSAT: 2030 Max O3 On-Road Mobile Contributions • Western US • Eastern US CAMx Zero-Out CAMx OSAT
Comparison of Source Attribution Approaches • Generally good agreement between CMAQ and CAMx zero-out results • OSAT generally predicts larger contributions of tracked anthropogenic source categories, particularly on-road mobile emissions, due to non-linearities which can be large with BFM 2030 O3 Calculated Ozone ppb On-Road
CAMx O3 OSAT Apportionment-NOxvs VOC NOx VOC Ozone Contributions % Global BCs Point Source Leftover Emissions Natural (Bio+Fires) Off-Road On-Road Other Area
CAMx O3 OSAT Apportionment-NOxvs VOC On-Road Mobile Contributions to 2030 O3 • Western US • Eastern US
2030 HDDM Results: NOx vs. VOC Effects of 20% Reductions in On-Road Mobile NOx or VOC Emissions
2030 HDDM Results: HDDMvsBFM Effects of 20% Reductions in On-Road Mobile NOx and VOC Emissions
HDDM vs BFM Results Effects of 20% Reductions in On-Road Mobile NOx and VOC Emissions • Western US • Eastern US 2030 HDDM 2030 BFM
Conclusions • Results from CMAQ and CAMx zero-out simulations are generally comparable • The sum of the source contributions in the zero-out simulations does not add up to the base value because of the inherent non-linearity in the system, resulting in sometimes large contributions of the so-called “unexplained” category with the brute force method • Because of the non-linearity, the zero-out method predicts generally lower source attributions of anthropogenic source categories than OSAT • Ozone responses to 20% reductions in NOx and VOC emissions calculated from HDDM sensitivity coefficients and BFM results are generally similar • Both apportionment (OSAT) and sensitivity (HDDM) approaches provide valuable information on source culpability at a lower cost than a large number of brute force calculations; the choice of the tool to be used depends on the study objectives