Download
1 / 90
910 likes | 1.09k Vues
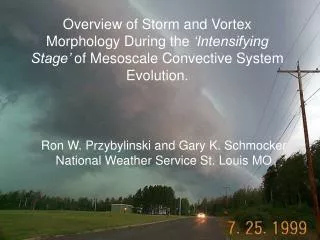
Overview of Storm and Vortex Morphology During the ‘Intensifying Stage’ of Mesoscale Convective System Evolution. Ron W. Przybylinski and Gary K. Schmocker National Weather Service St. Louis MO. Introduction.

E N D
Overview of Storm and Vortex Morphology During the ‘Intensifying Stage’ of Mesoscale Convective System Evolution. Ron W. Przybylinski and Gary K. SchmockerNational Weather Service St. Louis MO
Introduction This presentation is based on a small sample of WSR-88D Doppler radar observations (24 cases) collected over the Mid-Mississippi Valley Region and adjacent areas from 1992 – 2000. The goal is to share insights into the storm- circulation evolution - during the ‘Intensifying Stage’ (Pre-Bow Echo – Early stages of BE) of Mesoscale Convective Systems. Preliminary storm conceptual models and examplesof WSR-88D imagery of severe convective lines andtornadic (or non-tornadic) circulations during this stage will be shown.
Outline of our Presentation 1. Some recent work 2. Data Analysis3. Preliminary stratification of data4. Studies using multiple data sets5. Pre-convective environment 6. Conceptual storm models derived from our data setincluding WSR-88D examples. 7. Mesocyclone characteristics of the 1st , 2nd and subsequent vortices. 8. Summary
We will focus on: 1. Diagnosis of the pre-convective environment (shear / (CAPE considerations).2. the evolutionary reflectivity – Doppler velocity characteristics during the MCS’s ‘Intensifying Stage: (four preliminary storm conceptual models derived from 22 of the 25 cases) 3. Document location of initial damaging winds reports during this stage.4. First approximations of how you can determine the depth of a stable layer north of a low-level boundary. 5. Characteristics between tornadic and non-tornadiccirculations (Rotational Velocity [Vr] traces).6. Compare these characteristics to mesocyclones associated with traditional supercells (Burgess et al. 1982; 1995)
(1) Recent Studies Utilizing Doppler Radar: Installationof the WSR-88Ds brought a surge of studies onbow echo evolution (e.g. Funk et al. 1997; 1999); Przybylinski et al. 1997; Schmocker et al. 1998;Pence et al. 1998; Spoden et al. 1999; Wolf 2000; and others. Regional Bow Echo studies utilizing WSR-88D data sets: - Klimowski et al. 2000 - Przybylinski et al. 2000Trapp and Weisman (2000) were successful in simulatingnon-supercell tornadogenesis with Quasi-Linear ConvectiveSystems (QLCS).
(2) Data Analysis - Low-level and elevated boundaries (including fronts) were documented in many of our cases. - Boundaries were identified by: - hourly surface mesoscale analyses - radar imagery (fine lines / lines of small convective cells) - visible satellite data - Archive level II (90%) and Level IV data (10%) (KLSX, KEAX, KILX, KPAH) were used in our study. - Rotational velocity (Vr) time-height traces were constructed to show mesocyclone characteristics.- Ground Surveys were conducted in 19 of the 25 cases
(3) Preliminary Stratification of Data (Left Graphic) Pathways of linear to bowing MCS events (12 cases studied) for the period 1992 – 1997. (Right Graphic) Pathways of linear to bowing MCS eventsstudied or under study (12 cases) for the period 1998 – 2000.
Monthly distribution of MCS events (cases studied or understudy) across the Mid-Mississippi Valley Region (1992 – 2000) (Note – most of the events during the month of Mayoccurred after May 15).
Mid-Mississippi Valley Severe Wind Frequency (time ofwind damage reports for 22 cases (1992 – 2000)
Mid-Mississippi Valley Tornado Frequency for squall lines(cases studied) 1992 - 2000. Tornadoes occurred with10 MCS events. (Working with a small sample)
4. Squall Line Studies (Early work) Forbes and Wakimoto (1983) conducted a detailed analysis of the 6 August 1977 bow echo event across central Illinois. Numerous downbursts (microbursts) and 18 tornadoes wererecorded with this event. (17 were cyclonic / 1 anticyclonic).
WSR-57 Radar Data from KSTL on 6 August 1977. The white dots represent locations of downburst (and tornadoes).Time is in UTC. (From Forbes and Wakimoto 1983).
Squall Line Studies (recent work) - Utilizing a special Doppler data set from Australia, Rasmussen and Rutledge (1993) showed that an MCS evolved through four stages: - Formative - Intensifying - Mature - Dissipating - They described MCS evolution as a ‘ continuum ofchanges’ of the kinematic and reflectivity structurescharacterized by a gradual tilting of the flow branchesand reduction of updraft strength and echo intensity. • RR defines the‘Intensifying Stage’when the convective line evolves into a nearly solid line echo. - cell towers reach their greatest height - updraft intensity is strongest
- Early stages of the flow branches. - Front to Rear Flow - Mesoscale Rear Inflow - Shaded region betweenthese two branches is definedas a ‘sloping zone of negative horizontal vorticity’ - Negative horizontal vorticity results from strong horizontal gradients of buoyancy: - positive buoyancy due to heating of condensation / freezing along the leading edge.- negative buoyancy due to cooling of evaporation, melting, and condensate loading (convective towers).
- Preliminary findings from our COMET study showed that the leading edge of this zone of ‘negative horizontal vorticity’is a preferred region for vortex generation.- Convective-scale vorticies(tornadic and / or non-tornadic may form along the leading edge of this zone (release of a horizontal shearing instability along the leading edge of the convective system)
Studies of the Mesoscale Rear Inflow (Klimowski 1994) • Klimowski studied the evolution of a mesoscale rear inflow jet (RIJ) with NCAR’s CP3/CP4 5 cm research Doppler radars. The study was conducted over the southern part of North Dakota. We will take a look at cross-sections A and B.
Reflectivity / velocity cross-sections of “Series A.” Reflectivity contours are solid. Shaded region represents the evolution of the mesoscale rear inflow jet (Klimowski 1994).
Observations documented by Klimowski - Rear inflow was initiated near the high reflectivity cores of the squall line and largely elevated.- Maximum values of the rear inflow were initially located near the high reflectivity cores.- The rear inflow was not homogeneous along the length of the squall line. - Rear inflow was stronger where the trailing stratiform precipitation region formed.- Slight positive correlation between the development of therear inflow and the front-to-rear flow.
Low-level Boundaries - Second important preliminary findingfrom several of our cases was the presence of:- a low-level boundary from earlier convection or- an old quasi-stationary frontal boundary - Either of these features were frequently oriented orthogonal to the approaching convective line. - 17 of the 22 MCSswe studied appeared to be directly influenced by either a low-level or elevated boundary.
How important areboundaries? Very important - Boundaries serve intwo ways:1) local forcing mechanism for convective initiation2) as a source of local vorticity augmentation for convective-scale vortices. - From the Vortex Project Markowski et al. 1998 and Rasmussen et al. 1994 showed that nearly 70% of all tornadoes observed in VORTEX were associated with boundaries.
(6) Storm Conceptual Models - Four Groups of storm morphologies were derived from our preliminary data set. A fifth group, classifed as ‘other’ was needed for 3 cases. Four storm conceptual models included: 1) Low-level boundary intersecting the northern part of the convective line (8 cases).2) Low-level boundary or frontal boundary intersecting the southern part of the convective line (7 cases). 3) East-west frontal boundary located 30 to as much as 150 km south / southwest of the MCS (5 cases)4) Low-level boundary intersecting the updraft region of a High-Precipitation (HP) supercell (2 cases).
1. Low-level boundary intersecting the northern end of a convective line. - 8 cases - 6 events late afternoon or early evening.- 1 event early morning.- 1 event mid morning. a) Reflectivity Characteristics:Line of small isolated cells orreflectivity fine line intersects and extends downwind from the northern end of the larger linear convective line (pre-bowing). - east-west line of isolated cells reflect location of low-level boundary.- First reports of damaging winds occurred: - south of the intersection in all seven cases.
b) Group 1: Circulation Trends: • In all 8 cases, first two circulations formed in the vicinity of the low-level boundary – convective line intersection. - In 3 of the 8 events, numerous circulations (4 cores or more) were identified along the cyclonic shear side of the developing bow (northern end to near the apex).- Core 3 and subsequent cores occurred as much as 10 to 15 minutes after initial identification of Core #2. - Non-supercell tornadoes (F0 – F1) occurred in each of these 3 events, with Cores 2 and 3; and with Core 4 in one of the three cases. - All three events – moderate shear / high CAPE; - In the remaining 5 cases; 2 or 3 mesocyclone cores were documented. Weak tornadoes (F0) occurred in two of the five events.
b) Group 1: Circulation Trends cont’ Circulation characteristics:- In 5 of the 8 events, first two cores formed in the vicinity of an isolated cell (anchored to a boundary) – convective line merger (preferred region of enhanced convergence – vertical stretching of the updraft). - Remaining three cases – first two cores formed near an external boundary (fine line) – convective line intersection(but no cell-line merger).- Core #1 – weaker Vr magnitudes / shallower depths compared to Core #2.- Core #2 – stronger Vr magnitudes, greater depth, upscale growth (non-descending) and longest lifetimes. - Core #3 and subsequent cores – non-descending characteristics, similar Vr magnitudes, nearly equal depth, however often shorter lifespan compared to Core #2.
2103 UTC 29 June 1998 reflectivity (0.5°)(left); storm-relative velocity (right)from Lincoln IL (KILX). Convective towers extending southeast from thenorthern end of the large line reflects the location of an old outflow boundary. Circulation cores #1 and #2 formed at this intersection.
2126 UTC 29 June 1998 reflectivity (0.5°) slice (left); storm-relative velocity(right). Circ #2 intensified rapidly since 2103 UTC and became tornadic(F1 damage). Core #3 became tornadic only during the very early stagesof its lifetime. Core #4 became tornadic after 2135 UTC.
2126 UTC 29 June 1998 reflectivity (0.5° slice)(left); storm-relative velocity with TVSs (TDA) output (right).
Comparison between Mesocyclone Cores 1, 2, and 3 Core #1 – weaker rotation /lower overall depth comparedto Core #2. Time-height Vr trace Core #1. Core #2 – upscale growth (non-descending characteristics)with strongest rotation detectedwithin lowest 3 km. - Tornado produced F1 damagebetween 2120 and 2126 UTC just before Core #2 reached itsgreatest depth. Time-height Vr trace Core #2.
Core #2 - Showed ‘non-descending’characteristics with the strongest rotation detected within the lowest 3 km.- Tornadogenesis occurred just before Core 2 reached its greatest height and during the period of strongest low-level rotation.- On Circulation diameter trace note the drop in core diameter between 2114 and 2120 UTC – just before tornado-genesis.
Core #3:- Showed rapid ‘non-descending’ characteristics during theearly stages of the circulation’s lifespan.- Strong gate-to-gate shears [Delta V] were detected during the first two volume scans.- Non-supercell tornadooccurred between2109 – 2120 UTC. - Second peak (vortexstretching) occurred at 2144 UTC – and a secondtornado occurred.
Core #4- showed similarcirculation trends toCirc #2. - Non-descending characteristics with the strongest rotationdetected within the lowest 3 km.- Tornadogenesis occurred just precedingthe core reaching its greatest height and strongest rotation withinthe lowest 3 km.
2155 UTC 29 June 1998 reflectivity (0.5° slice) (left); storm-relative velocity(right). Large-scale circulation (C2a) associated with comma-head echo is referred to as a ‘Line-end Vortex.’ Most extensive wind damage occurredalong and south of this circulation’s path (Leading Edge -Dashed Red Line).
2207 UTC 29 June 1998 reflectivity (left) / SRM velocity (right) (0.5° slice) from KILX. Line-end vortex C2a broadens and becomes an unbalancedvortex. Note the weakness in the reflectivity field along the southern peripheryof the line-end vortex (west of the red dashed line). These convective cells donot mature compared to the cells further southwest along the line due to thesystem cold pool overwhelming the ambient shear.
Rotational Velocity (Vr) Trace of Circulation 2a (Line-end Vortex). Magnitudes of Vr are shown in (m/s). Note: some of the strongestrotation was documented below 2 km during the period of 2149 - 2202 UTC. Could this vortex play a role in focusing or enhancingsurface wind damage along the southern periphery of the circ.?
Map of Circulation Tracks C1 and C2 and Line-end Vortex C2a acrossnorth-central Illinois. Squall line positions are denoted every 30 min. T signifies location of tornadic damage. Significant wind damage (est > 70 kts) occurred over and east of Peoria IL (PIA) across northern Taswell through McLean counties in Illinois (along the southern peripheryof the line-end vortex). Wind damage continued downstream for the next1.5 hours after the demise of the line-end vortex.
Line-End (Bookend) Vortex(Weisman 1993) - Velocity field – is a vector sum of the velocity field induced by each vortex. - Enhancement of the flow between the vortices can be interpreted as a focusing effect of the vortex couplet.- The strength of the RIJ is dependent on the sizes and magnitudes of the vortices as well as the spacing between them. - Environmental shear and tilting of ambient horizontal vorticity by updraft – downdraft couplets associated with intense convective cells appear to play roles in the generation of line-end vortices.
2. Low-level boundary intersecting the southern end of the convective line. - 7 cases- 5 late evening – early morning events - 2 late afternoon – early evening events. a) Reflectivity Characteristics- Two differing reflectivity patterns:(Pattern #1 – 3 cases)- line of small isolated cells or reflectivity fine line intersects, and extends downwind from the southern part of the larger convective line. - line of small isolated cells is frequently oriented orthogonalto the larger convective line.
Pattern #2 - Similar to the firstpattern except that multiple convective cellsare noted well north ofthe warm frontal or alow-level boundary. - First and secondcirculations often formin the vicinity of the boundary – convectiveline intersection. - Two of the seven cases support this pattern.
First Reports of damaging winds and initial bowing:- 29% (2 of the 7 events) north of the low-level boundary – convective line intersection - 42% (3 of the 7 events) south of the intersection. - 29% (2 of the 7 events) both north and south of the low-level boundary – convective line intersection.
b) Circulation Trends: • In 6 of the 7 events, first two cores formed in the vicinity of a boundary – convective line intersection.- In the remaining case, first or second cores were not observed in the vicinity of the intersection.- In 5 of the 7 events, numerous cores (4 or more) were identified along the cyclonic shear side of the bow (northern end to near apex of the bow).- Core 3 and subsequent cores developed after the first two cores by 5 to as much as 15 minutes. - In the remaining 2 cases, only three cores were documented throughout the bow echo evolution.
b) Circulation Trends cont’ - Non-supercell tornadoes (F0 – F1 damage) occurred in 3 of the 5 numerous core events – with Cores 2 and 3 . However, non-supercell tornadoes did not occur with the remaining 2 events.- In all five events – moderate shear was present. However, magnitudes of CAPE ranged from 2200 – 3000 J/kg in 4 cases and near 3500 J/kg in the 5th event.- Non-supercell tornadoes (F0 – F1 damage) occurred in 1 of the 2 remaining MCS events where only 3 cores were documented. - Moderate shear was present, and magnitudes of CAPE were 2000 and 3200 J/kg respectively.
1106 UTC 14 June 1998 reflectivity (0.5° slice) (left); SRM velocity (right)(KLSX). Southern most line of small convective cells, intercepting a strong storm (hybrid supercell?) embedded within the line, appear to reflect location of the low-level boundary. The second parallel line - elevated boundary. Circulation core #1 and #2 formed with the southern-most line.
1116 UTC 14 June 1998 reflectivity (0.5° slice) left); storm-relative velocity(0.5° slice) (right). Circulation #2 intensified near the intersection of the smaller line of convective cells and the hybrid storm. As the smaller lineof convective cells (external boundary) passed over KLSX, magnitudes of 0-2 km SR helicity increased from 106 m2/s2 (0928 UTC) to 783 m2/s2 (1111 UTC).
1117 UTC 14 June 1998 reflectivity (left); SRM velocity (right) at 1.5° slice. C2 shows a symmetrical velocity pattern at 1.5° slicecompared to the cyclonic convergent velocity pattern seen at 0.5° slice. A gate to gate velocity couplet is noted near the southern periphery of C2. Delta-V magnitudes = 48 m s-1.
During the later part ofCore #2’s mature stage,this vortex appeared toplay a role in focusing the swaths of most intensewind damage. • A tornado occurred just prior to the circulationreaching its greatest heightand within the vicinity of strong low-level rotation (1131 – 1136 UTC).
Comparison of MesocycloneCores #1 and #2. - Core #1 – weaker rotation / shallower depth compared to Core #2. - Core #2 – strongest rotation, greatest overalldepth and upscale growth(non-descending) characteristics. Strongest rotation again was detected within the lowest 2 km.
Case #2: 26 May 2000 - Surface analysis 0200 UTC 27 May 00 - Warm front draped from surface low over northwest MO east-southeastward into south-central Illinois.- Surface dewpoints reaching mid 70s pooling near warm front over central and western Missouri.
Skew-T Log P KSGF 0000 UTC 27 May 2000 - Surface-based CAPE 2512 J/Kg- Mid-level region relatively dry – supportive of damaging winds.- Bulk Shear (0-3 km) 17 m s-1; (0-5 km) 22 m s-1.
KLSX VWP Profile for 0217 UTC – 27 May 2001 - 0-2 km SRH 362 m2s-2- 0-3 km SRH 424 m2s-2-Note ‘kink’ in lowest 2 kft of hodograph- Roger Edwards and Rich Thompson from SPC have observed this type of hodograph structure in supercells.- The ‘kink’ represents a transition from strong speed shear / little directional shear to stronger directional shear / weakerspeed shear.