Download

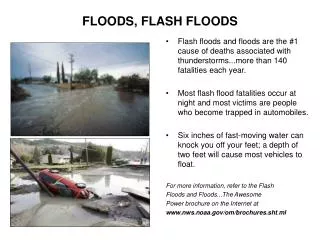
1 / 27
270 likes | 376 Vues
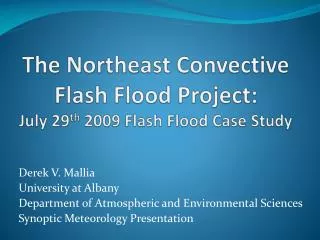
Northeast Convective Flash Floods: Helping Forecasters Stay Ahead of Rising Water. Joe Villani - National Weather Service, Albany, NY Derek Mallia - University at Albany ER Flash Flood Conference – June 2-4, 2010. Goals.

E N D
Northeast Convective Flash Floods: Helping Forecasters Stay Ahead of Rising Water Joe Villani - National Weather Service, Albany, NY Derek Mallia - University at Albany ER Flash Flood Conference – June 2-4, 2010
Goals • Better anticipate meteorological environments that produce flash flooding (FF) • Forecast “watch” phase of a FF event (12-24 hours in advance) • Identify factors that may distinguish days with isolated vs. widespread FF
Methodology • Investigated 39 FF events from Albany County Warning Area (CWA) • Warm season events from 2003 through 2009 (non-tropical) • Classified events based on type of dominant feature when FF occurred
Methodology • Compiled sounding derived parameters for each event • Entered data in spreadsheet • Stratified data based on isolated vs. widespread events
Methodology • Isolated = FF occurring over a small area resulting from one cluster of convection • Widespread = FF occurring over a large (or multiple) area(s) resulting from several clusters of convection
Methodology • Composite plots of synoptic scale features using CDC website • Compared composites for days with widespread vs. isolated FF • Signatures evident in: • 500 hPa height anomalies • 850 hPa meridional wind anomaly • 250 hPa zonal wind mean
Data Sources • Weather Event Simulator (WES) • Archived local AWIPS data • Radar, satellite, surface observations, observed soundings, model initialized soundings • Soundings from 12 UTC or 18 UTC • Times preceded FF occurrences • Data mainly from ALB, some OKX
Significant Features • Four different classifications: • Cut-off Low • Frontal (cold, warm, stationary) • Upper Level Ridge/Surface boundary • Upper Level Trough/Low (NOT cut-off)
Widespread vs. Isolated FF Comparison • Not much difference in parameters overall • Somewhat stronger max 0-3 km wind • Other parameters relatively insignificant • Signatures evident in composites plots of synoptic scale features
Widespread vs. Isolated FF Comparison Right Entrance Region of Jet Right Entrance Region of Jet 250 hPa Zonal Wind Mean
Widespread vs. Isolated FF Comparison • 250 hPa Zonal Wind Mean: • Northeast CONUS in pronounced right-entrance region of jet (widespread) • Jet displaced farther north and east and weaker (isolated)
Widespread vs. Isolated FF Comparison Stronger Negative Height Anomaly Weaker Negative Height Anomaly 500 hPa Geopotential Height Anomaly
Widespread vs. Isolated FF Comparison • 500 hPa Geopotential Height Anomaly: • Much stronger negative anomaly across Great Lakes and Midwest regions (widespread) • Stronger positive anomaly across Canadian Maritimes, Hudson’s Bay and Pacific NW (widespread)
Widespread vs. Isolated FF Comparison Weaker Meridional Wind Anomaly Stronger Meridional Wind Anomaly 850 hPa Meridional Wind Anomaly
Widespread vs. Isolated FF Comparison • 850 hPa Meridional Wind Anomaly: • Stronger and more expansive positive anomaly (southerly wind component) across Eastern New York into New England (widespread)
Observations/Conclusions • Widespread FF more likely with Cut-off Lows • 8 of 12 Cut-off Low events resulted in widespread FF • Most events occurred in June/July and during the afternoon and evening hours
Observations/Conclusions(From Sounding Data) • Most events exhibited veering wind profile in lowest 3 km • Less directional shear for widespread events • Mainly unidirectional flow 3-6 km • “Tall/Skinny” character of CAPE for most events
Observations/Conclusions • Surface dewpoints in the 60s-70s for all events except one • June 15th 2009 dewpoints in the 50s • Almost all cases exhibited positive Theta-E advection at 850 hPa
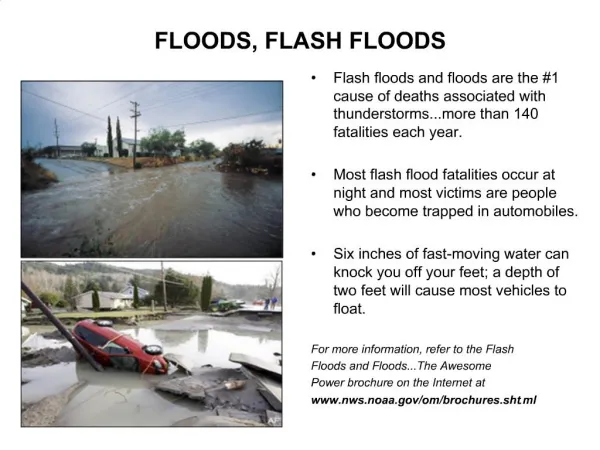
Observations/Conclusions(Storm Scale) • FF producing cells were either: • Low Echo Centroids – most of significant reflectivity below 0°C level (warm cloud processes resulting in high efficiency rainfall) • Slow-moving cells with taller updrafts (some produced hail and FF) • Training cells (repeatedly moved across the same areas)
Example of LEC 0°C level
Observations/Conclusions • Freezing level and PWAT may be a good indicator FF in general: • Average FZL = 13,200 ft • Average PWAT = 1.68” • However, they do NOT distinguish between isolated/widespread events
Future Work • Look for synoptic features (from composites) when forecasting isolated vs. widespread FF • Develop updated FF checklist for staff at Albany • Investigate hydrologic component of FF?
Acknowledgments • Derek Mallia, University at Albany • Julie Gabriel, University of Delaware • Neil Stuart, NWS Albany
Questions? Joe.Villani@noaa.gov Courtesy: Brian Frugis