Sketching Polynomials
Sketching Polynomials. John Du, Jen Tran & Thao Pham. Things to know:. A polynomial function is a function of the form f(x) = a n xⁿ + a n-1 xⁿ¯¹ + … + a₁x + a₀ a n is the leading coefficient a₀ is the constant term n is the degree of the polynomial.

Sketching Polynomials
E N D
Presentation Transcript
SketchingPolynomials John Du, Jen Tran & Thao Pham
Things to know: • A polynomial function is a function of the form f(x) = anxⁿ + an-1 xⁿ¯¹ + … + a₁x + a₀ • a n is the leading coefficient • a₀ is the constant term • n is the degree of the polynomial
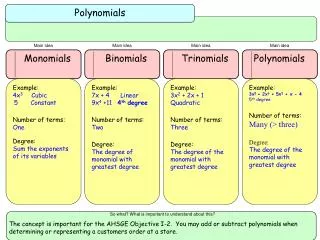
Here is a table of the common polynomials: • Each graph curves differently depending on its degree.
Linear • There are two forms of linear functions. • Slope-intercept Form: y = mx + b - The slope of the graph is m. - The y-intercept of the graph is b. • Standard Form: Ax + By = C -Find the x-intercept by making y = 0 -Find the y-intercept by making x = 0 • The linear function crosses the x-intercept in a line.
Here’s an example: x – 4y = -8 • Make y = 0 to find the x-intercept, -8 • Make x = 0 to find the y-intercept, 2 • Since a is positive, the graph is positive.
Quadratics • Quadratics have graphs that are “U” shaped, these are called parabolas. • The x-intercepts of the parabola is called the zeros of the function. • Quadratic function has the form y = ax² + bx + c • The x-coordinate of the vertex is –(b/2a), which is also the axis of symmetry.
There are two forms of quadratic function: • Vertex Form: y = a(x – h)² + k - The vertex is (h,k) - The axis of symmetry is x = h • Intercept Form: y = a(x – p)(x – q) - The x-intercepts are p and q - The axis of symmetry is halfway between (p,0) and (q,0) • If a > 0, then graph opens up. If a < 0, graph opens down.
Let’s look at an example: y = (x + 2)(x – 3) • This equation is in intercept form so you should graph the zeros first.
Since a is 1, we know that the graph will open up. • We know that the vertex is between (p,0),(q,0) so you plot the vertex and draw the graph.
Cubic • Basically you now know how to graph polynomials. It is important to graph the intercepts on the graphs. • Then, you have to think about the end behavior of the graph. • For a cubic function, the graph looks like an “S” or a squiggly line. • Ex: or
Cubic functions look like: f(x)= ax + bx + cx + d • The parent function of cubic functions is simply: f(x)=x
f(x) = ax + bx + cx + d • Coefficient "a" in the equation above is to make the graph "wider" or "skinnier", or to reflect it (if negative.) • Coefficient "b" represents a quadratic function. • Coefficient "c" represents a linear function. • Coefficient "d " is the y-intercept. (In this case, a=1, therefore all 3 lines are neither skinnier or wider than the other.)
There are 2 different ways to determine whether a graph moves/left/right. • If f(x) = (x + a) and a > 0, the graph undergoes a horizontal shift d units to the left. • If f(x) = (x + a) and a < 0, the graph undergoes a horizontal shift d units to the right. The equation for this is f(x) = (x+1) Because 1 > 0, the graph moves to the left 1 space.
Quartic • A quartic graph looks like a “W” or a "M" • Ex: or
The equation of a quartic looks like this model: f(x)= ax + bx +cx +dx+ e • The parent function of a quartic is f(x)= x • The leading coefficient determines of the graph faces up or down.
If a is negative, both side of the graph will go to negative infinity. • If a is positive, both side of the graph will go to positive infinity.
Understanding Knowing the the rules about powers, it helps you to predict what the graphs would look like without graphing it all. Usually you would first graph the zeros. The importance of zeros are that they're the x-intercepts and it is the locations where the changes of the graph happens.
Applying the skills f(x) = (x-5)³ (x+4)² (x-1) • First, identify the zeros: 5, -4, and 1 • Then, predict the curve of the graph at each zero: at x = 5, the graph curves through, at x = -4, that is the vertex of a parabola and at x = 1, the graph just goes through because it is linear.
For more practice Algebra II Textbook: • Page 334 Questions 49 - 52 • Page 335 Questions 65 - 79
For more help!! Here is a useful video!