Download
1 / 27
300 likes | 515 Vues
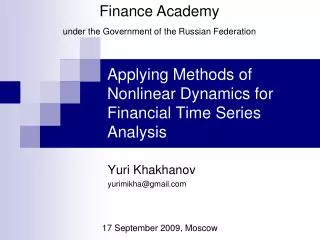
Finance Academy under the Government of the Russian Federation. Applying Methods of Nonlinear Dynamics for Financial Time Series Analysis. Yuri Khakhanov yurimikha@gmail.com. 17 September 2009, Moscow. Contents. Time Series Entropy Definition of K2-entropy

E N D
Finance Academyunder the Government of the Russian Federation Applying Methods of Nonlinear Dynamics for Financial Time Series Analysis Yuri Khakhanov yurimikha@gmail.com 17 September 2009, Moscow
Contents Time Series Entropy Definition of K2-entropy Estimating nonlinear parameteres of financial time series Final results Conclusions
Time series A Time Series is a sequence of data points, measured typically at successive times, spaced at uniform time intervals. Examples: stock indices, share prices, electrocardiogram, seismogram, etc.
Metric entropy Kolmogorov entropy: t – time, d(0) – initial distance (time t=0) d(t) – distance at time“t”. h=0 – regular dynamic (ordered system), 0<h<∞ - deterministic chaos, h→∞ - randomness.
Generalized entropy: • - joint probability that attractor trajectory visits cubes at times . • К1 isKolmogorov entropy, • K2is a lower bound for Kolmogorov entropy.
K2 entropy , where . - correlation integral. m – current embedding dimension ∆t=1 (day). K2-entropy is a limit of correlation integrals ratio.
К2-entropy Limit of K2-entropy can be approximated using the following function
Time horizon ‘T’ • Time horizon refers to a maximum time period, when chaotic system behavior forecasting is possible. where‘l’ – accuracy of задания initial position • When t>T only statistical forecasts are possible.
К2-entropy К2 ≈ 0,15 Т ≈ 6-7 days
К2-entropy (1,5 year before the crisis) К2 ≈ 0,17-0,18 Т ≈ 5-6 days
К2-entropy (1,5 year during the crisis) К2 ≈ 0,13-0,14 Т ≈ 7-8 days
К2-entropy К2 ≈ 0,09 Т ≈ 11 days
К2-entropy (1,5 year before the crisis) К2 ≈ 0,17 Т ≈ 6 days
К2-entropy (1,5 year during the crisis) К2 ≈ 0,08 Т ≈ 12 days
К2-entropy К2 ≈ 0,13 Т ≈ 7-8days
К2-entropy (1,5 year before the crisis) • К2 ≈ 0,17 • Т ≈ 6 days
К2-entropy (1,5 year during the crisis) К2 ≈ 0,12 Т ≈ 8days
К2-entropy К2 ≈ 0,12 Т ≈ 8 days
К2-entropy (1,5 year before the crisis) К2 ≈ 0,15 Т ≈ 6-7 days
К2-entropy (1,5 year during the crisis) К2 ≈ 0,09 Т ≈ 11 days
Results Time horizons for periods before and during the crisis
Conclusions К2-entropy defines time horizon. К2-entropy for analyzed financial time series gives a green light to reliable 5-10 days forecast. In the periodbefore the crisis K2-entropy rises (Time horizon declines). During the crisis K2-entropy declines (Time horizon rises).