Visualization and Planning of Traffic Routes Based on Predicted Travel Times
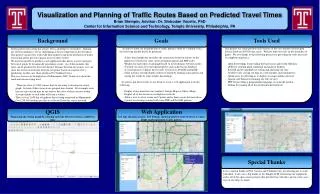
This project focuses on forecasting traffic patterns by utilizing a complex network of highway sensors in Minneapolis, MN. By creating a directional graph and assigning weights based on travel distances, the application allows users to visualize and select routes between points. Employing various open-source tools, such as Open Street Maps and QGIS, we provide a dynamic web application that displays optimal routes based on real-time data. Thank you to all contributors and open-source communities that supported this initiative.

Visualization and Planning of Traffic Routes Based on Predicted Travel Times
E N D
Presentation Transcript
Visualization and Planning of Traffic Routes Based on Predicted Travel TimesBrian Stempin, Advisor: Dr. Slobodan Vucetic, PhDCenter for Information Science and Technology, Temple University, Philadelphia, PA Background • In order to allow for the prediction of traffic patterns (done by Vladimir Coric), the following models had to be produced: • A directional graph that describes the connections between sensors on the highways (Created via some clever geospatial queries and PHP code) • Weights for each edge of said graph based on travel distance between nodes (Created via some clever geospatial queries and cached in our database) • A visual means to validate these results (Created via PostGIS and QGIS) • Some statistics to help identify outliers (Created by running some queries and sorting the results by edge weight, descending) In order to put these results to use, I had to create a web application to do the following: • Display a base-layer that was similar to Google Maps or Yahoo! Maps • Display all of the sensors in our highway network • Allow a user to select a time and 2 points and to draw a route between those 2 points on our map (created with some PHP and PostGIS queries) Goals • This project was made possible only because of the vast amount of Free/Open Source Software (F/OSS) that exists. We have built our tools on the shoulders of giants. We owe thanks to the following projects for providing the tools necessary to complete our project: • Open Street Maps for providing the base layers and for the GIS data • QGIS for creating quick validation and analysis displays • PostGIS and PostgreSQL for storing and analyzing our data • GeoServer for serving our data in a web-friendly and standard way • OpenLayers for allowing us to display our maps within a browser • Apache and Tomcat for running our web services • PHP for providing a programming language to create the models • Debian for running all of the aforementioned software Tools Used • Traffic pattern forecasting has always been a challenge to researchers. Making use of these findings is just as challenging as discovering them in the first place. This project's goals were to provide data models to aid in the prediction of traffic forecasting and to provide a practical use of these results. • We used our models to produce a web application that allows a user to navigate between 2 points by dynamically generating a route. As of this moment, this route can be produced to show the shortest distance between two points, or it can show the shortest travel time between two points based on someone else's predictions (in this case, those produced by Vladimir Coric). • This case focuses on the highways of Minneapolis, MN. Some facts about the roads and sensors being used: • There are close to 2,000 sensors that we are using to develop our sensor graph. Several of these sensors are grouped into stations. For example, each lane on a given road may be one sensor, but a few of these sensors within close proximity to each other will form a station • There is over 2,600 km of highway that is being monitored in Minneapolis • Over 288,000 readings per day are collected from this sensor network QGIS Displaying the station graph by coloring each line between stations a different color Web Application Left top: showing sensors; Left bottom: showing shortest route between 2 senors; Right:showing historic traffic pattern Special Thanks I owe a special thanks to Prof. Vucetic and Vladimir Coric for allowing me to work with them. I also owe a big thanks to the Temple ACM for housing my equipment and to all of the open-source projects that provided me with data, and in some cases, one-on-one help via email.