Download
1 / 26
290 likes | 732 Vues
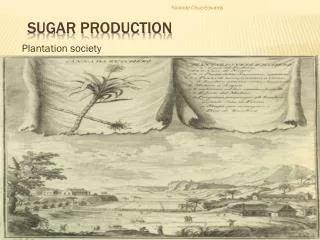
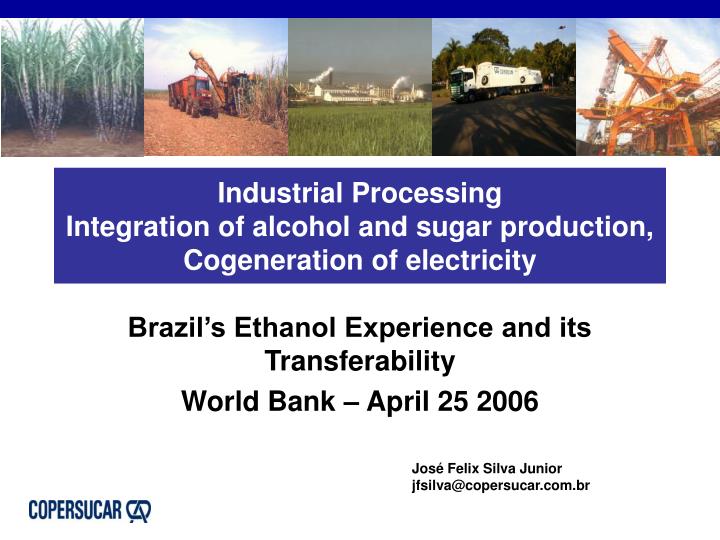
Industrial Processing Integration of alcohol and sugar production, Cogeneration of electricity. Brazil’s Ethanol Experience and its Transferability World Bank – April 25 2006. José Felix Silva Junior jfsilva@copersucar.com.br. What it will be tried to show.

E N D
Industrial Processing Integration of alcohol and sugar production, Cogeneration of electricity Brazil’s Ethanol Experience and its Transferability World Bank – April 25 2006 José Felix Silva Junior jfsilva@copersucar.com.br
What it will be tried to show • Productions of sugarcane, sugar and ethanol • Operations flowsheet and productions alternatives • Fermentation and distillation – basic figures • Sugarcane quality – Calculated yields • Main characteristics of the integration process • Energy generated by sugar cane • Expansion of the sugar and ethanol industry • Scenario for ethanol demand • Improvements and innovation
Sugarcane – Source of Green Energy SUGAR JUICE Ethanol BAGASSE CO-GENERATION OF ELECTRICITY LEAVES & TOPS
Brazilian Production of Sugarcane, Sugar and Ethanol Crop Season 05/06 partial results
Brazilian Production of Anhydrousand Hydrated Ethanol Crop Season 05/06 partial results
Fermentation Process Basic information • Final ethanol content: 9 %vol • Final yeast concentration:13% • Fermentation time: 6-11h • Average production rate : 450 m3/day • Total fermenter capacity: 3000 m3 • Yield (stoichiometric): up to 91% • Temperature: 34-36ºC
Distillation • Steam consumption: 3-5 kg / L ethanol • Yield: > 99% • Residues: • Vinasse (12-15 L/L): recycled as ferti-irrigation at the cane fields • Water consumption: • 100-120 L / L ethanol (hydrated 93% by weight ) • 140-170 L / L (anhydrous 99.4% by weight) • Dehydration: Azeotropic (cyclohexane) Extractive (monoethyleneglycol) Molecular sieves
Ethanol from Molasses and Juice SUGARCANE Sugars = Suc + Glu + Fru MILLING JUICE FOR SUGAR JUICE FOR ETHANOL MASH FACTORY DISTILLERY FERMENTATION DISTILLATION MOLASSES ETHANOL FROM MOLASSES ETHANOL FROM SUGARS SUGAR ETHANOL
Production Alternatives for Sugar and Ethanol (Calculated for 1 t of cane) Sugar & Ethanol from Final Molasses Sugar 50% sucrose Ethanol 50% sucrose+ RS from cane + sugars from molasses All Sugars to Ethanol
Integration Production of Sugar and Ethanol Main Characteristics • Extended crop season – beginning and end with ethanol production • Cane of low content of sugar and purity goes to ethanol production • Use of juices from different steps of the process – low purity juice from milling, etc. • No hard work to recover sugar in final molasses • No loss in final molasses
Integration Production of sugar and Ethanol Main Characteristics • Sugar of better quality – no need to recycle molasses of low purity • Higher purity in the mash (treated juice + molasses) for high fermentation yield • Energetic optimization – bleeding of steam for the distillery • Variation on the ratio of sugar and ethanol produced according to the market
Energy Generated by Sugarcane 1 t of Cane Stalks (Clean) Energy (MJ) 145 kg of sugars 2 300 140 kg of stalk fiber (bagasse, dry basis) 2 600 140 kg of leaves fiber (trash, dry basis) 2 600 Total 7 500(0.17 toe) 1 ha82 t cana 600 GJ (13 toe) 300 million tons of cane 50 million toe/year Note: Primary energy consumption in Brazil is 235 million toe/year.
Electric Power Generation Potential • Sugar mill is self sufficient in energy, using bagasse as fuel during the crop season • Some mills produce surplus energy to sell: • Installed capacity: 2,800 MW (100 %) • Self-consumption: 2,200 MW (78 %) • Contracted: 600 MW (22 %) (Sao Paulo 500 MW > 46 plants) • Short-term potential – today technology – 6,000 to 8,000 MW • Long-term potential – new technologies and increase in sugarcane – 15,000 to 22,000 MW Source – ANEEL (National Electric Power Agency / UNICA
Expansion of the Sugar and Ethanol Industry New projects
Copersucar’s Scenario for Ethanol Demand 27,3 30,0 24,8 22,6 5,2 25,0 20,6 18,6 4,6 1,0 4,0 16,8 0,9 20,0 3,5 0,9 2,9 0,9 2,2 0,9 15,0 0,8 21,1 19,3 10,0 17,7 16,2 14,8 13,8 5,0 0,0 2008/09 2005/06 2006/07 2007/08 2009/10 2010/11 Industrial Fuel Exports millions of m3
Improvement and Innovation (R&D) Work has to be done to: • Automatic process control • Treatment of the mash • High ethanol yeast • Immobilized yeast / Flocculant yeast • Reducing of the vinasse produced • Specific Membranes for dehydration • Vacuum distillation
Improvement and Innovation (R&D) Energy • Reduction of steam consumption 500 – 350 – 280 kg/tc (needs investment) • Use of trash (leaves and tops) as fuel • High pressure and more efficient boilers and turbine generators • Gasification of bagasse
Thank you José Felix Silva Junior jfsilva@copersucar.com.br