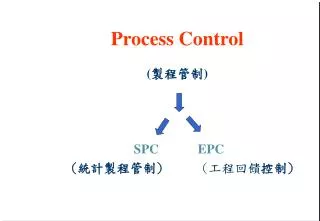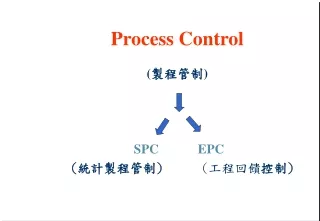
The Control Process
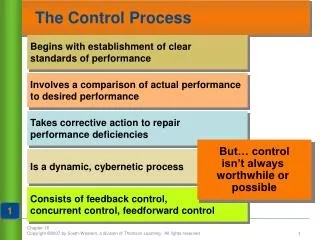
Begins with establishment of clear standards of performance. Involves a comparison of actual performance to desired performance. Takes corrective action to repair performance deficiencies. Is a dynamic, cybernetic process.

The Control Process
E N D
Presentation Transcript
Begins with establishment of clear standards of performance Involves a comparison of actual performance to desired performance Takes corrective action to repair performance deficiencies Is a dynamic, cybernetic process Consists of feedback control, concurrent control, feedforward control The Control Process But… controlisn’t always worthwhile or possible 1
Setting Standards • A good standard must enable goal achievement. • Listening to customers or observing competitors. • Benchmarking other companies. • Determine what to benchmark. • Identify the companies against which to benchmark. • Collect data to determine other companies’ performance standards. 1.1
Comparison to Standards • Compare actual performance to performance standards. The use of “secret shoppers” helps verify that performance standards are being met. 1.2
Identify ControlProcess Correct Analyze Corrective Action • Identify performance deviations • Analyze those deviations • Develop and implement programs to correct them 1.3
Set Standards Develop & ImplementProgram for Corrective Action Measure Performance Compare with Standards AnalyzeDeviations IdentifyDeviations Dynamic, Cybernetic Process 1.4 Adapted from Exhibit 16.1
FeedbackControl Gather information about performancedeficiencies after they occur ConcurrentControl Gather information about performancedeficiencies as they occur FeedforwardControl Monitor performance inputs rather than outputs to prevent or minimizeperformance deficiencies before they occur Feedback, Concurrent, and Feedforward Control 1.5
Guidelines for Using Feedforward Control • Thorough planning and analysis are required. • Careful discrimination must be applied in selecting input variables. • The feedforward system must be kept dynamic. • A model of the control system should be developed. • Data on input variables must be regularly collected. • Data on input variables must be regularly assessed. • Feedforward control requires action. Feedforward Control 1.5 Adapted from Exhibit 16.2
Control Loss Is control worthwhile? Maybe, maybe not. Managers must assess the regulation costs and the cybernetic feasibility.
Bureaucratic Control • Top-down control • Use rewards and punishment to influence employee behaviors • Use policies and rules to control employees • Often inefficient and highly resistant to change 2.1
ObjectiveControl Use of observable measures of workerbehavior or outputs to assessperformance and influence behavior BehaviorControl Regulation of the behaviors andactions that workers perform on the job OutputControl Regulation of workers’ results oroutputs through rewards and incentives Objective Control 2.2
Don’t Cheat on Travel Expense Reports • Workers are often tempted to pad their travelexpense reports • It’s often justified by feeling that they are entitled • If you can’t trust an employee to be truthfulon an expense report, how can you trust them with decisions involving millions of dollars? DOING THE RIGHT THING Doing the Right Thing 2.2
Effective Output Control • Output control measures must be reliable, fair, and accurate. • Employees and managers must believe that they can produce the desired results. • The rewards or incentives tied to outcome control measure must be dependent on achieving established standards of performance. 2.2
Normative Control NormativeControl • Created by: • careful selection of employees • observing experienced employees & listening to stories about the company 2.3
Concertive Control ConcertiveControl Regulation of workers’ behavior anddecisions through work group values and beliefs • Autonomous work groups • operate without managers • group members control processes, output, and behaviors 2.4
Self-Control • Also known as self-management • Employees control their own behavior • Employees make decisions within well-established boundaries • Managers teach others the skills they needto maximize work effectiveness • Employees set goals and monitor their own progress 2.5
BalancedScorecard Budgets,Cash Flow, EVA Customer Defections Quality Waste andPollution What to Control? 3
Customer Perspective InternalPerspective Innovation and LearningPerspective FinancialPerspective The Balanced Scorecard 3.1
Advantages of the Balanced Scorecard • Forces managers to set goals and measureperformance in each of the four areas • Minimizes the chances of suboptimization • performance improves in one area, but at the expense of others 3.1
Cash flow analysis Predicts how changes in a business will affect its ability to take in more cash than it pays out Balance sheets Income statements Financialratios Provide a snapshot of a company’sfinancial position at a particular time Show what has happened to an organization’s income, expenses, and net profit over a period of time Used to track liquidity, efficiency, and profitability over time comparedto other businesses in its industry The Financial Perspective 3.2
Basic Accounting Tools Steps for a Basic Cash Flow Analysis • Forecast sales • Project changes in anticipated cash flows • Project anticipated cash outflows • Project net cash flows by combining anticipated cash inflows and outflows 3.2 Adapted from Exhibit 16.5
Basic Accounting Tools Parts of a Basic Balance Sheet • Assets • Current assets • Fixed assets • Liabilities • Current liabilities • Long-term liabilities • Owner’s equity • Stock • Additional paid in capital • Retained earnings 3.2 Adapted from Exhibit 16.5
Basic Accounting Tools Basic Income Statement SALES REVENUE - sales returns and allowances + other income = NET REVENUE - cost of goods sold = GROSS PROFIT - total operating expenses = INCOME FROM OPERATIONS - interest expense = PRETAX INCOME - income tax = NET INCOME 3.2 Adapted from Exhibit 16.5
LIQUIDITY RATIOS Current Ratio Quick (Acid Test) Ratio LEVERAGE RATIOS Debt to Equity Debt Coverage EFFICIENCY RATIOS Inventory Turnover Average CollectionsPeriod PROFITABILITY RATIOS Gross Profit Margin Return on Equity Financial Ratios 3.2 Adapted from Exhibit 16.6
RevenueBudgets Used to project or forecastfuture sales ExpenseBudgets Used to determine spending onsupplies, projects, or activities Profit Budgets Used by profit centers, which have“profit and loss” responsibility CashBudgets Used to forecast the cash a company will have for expenses Capital ExpenditureBudgets Used to forecast large, long-lasting investments Variable Budgets Used to project costs acrossvarying levels of sales/revenues Common Kinds of Budgets 3.2 Adapted from Exhibit 16.7
Economic ValueAdded The amount by which company profits exceed the cost of capital in a given year Economic Value Added (EVA) Common Costs of Capital • Long-term bank loans • Interest paid to bondholders • Dividends and growth in stock value that accrue toshareholders 3.2
1. Calculate net operating profit after tax $3,500,000 2. Identify how much capitalthe company has invested $16,800,000 3. Determine the cost paidfor capital 10% Multiply capital used (step 2)times cost of capital (step 3) (10% x $16,800,000) = $1,680,000 5. Subtract total dollar cost of capital from net profit after taxes $3,500,000 net profit -$1,680,000 cost of capital$1,820,000 EVA Economic Value Added (EVA) 3.2 Adapted from Exhibit16.8
Why Is EVA Important? • Shows whether a business, division, department, profit center, or product is paying for itself • Makes managers at all levels pay closer attention to their segment of the business • Encourages managers and workers to be creative in looking for ways to improve EVA performance 3.2
The Customer PerspectiveControlling Customer Defections • Monitoring customer defections: • identify which customers are leaving the company • measuring the rate at which they are leaving • Obtaining a new customer costs five times as much as keeping a current one • Customers who have left are likely to tell you what you are doing wrong • Understanding why a customer leaves can help fix problems and make changes 3.3
The Internal PerspectiveControlling Quality Excellence Value Conformance to Expectations 3.4
The Internal PerspectiveControlling Quality 3.4 Exhibit 16.12
Good housekeeping Material/product substitution Process modification Controlling Waste and Pollution 3.5
Waste Prevention & Reduction Recycle & Reuse Waste Treatment Waste Disposal Controlling Waste and Pollution 3.5 Adapted from Exhibit 16.13