Download

1 / 15
160 likes | 451 Vues
Allele Frequencies and Genetic Equilibrium. (Population Genetics). Allele Frequencies. How common certain alleles are in a population of organisms Example:

E N D
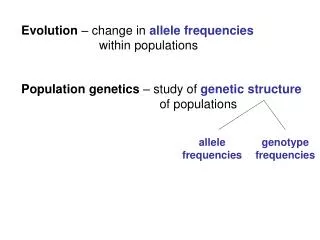
Allele Frequencies and Genetic Equilibrium (Population Genetics)
Allele Frequencies • How common certain alleles are in a population of organisms • Example: • The frequencies of the allele for blood types A, B, and O differ from group to group, in some groups, A is the most common, in others, B is…and so on.
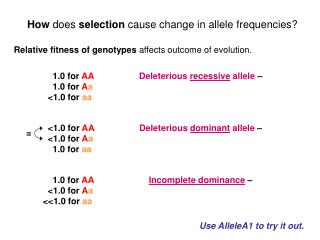
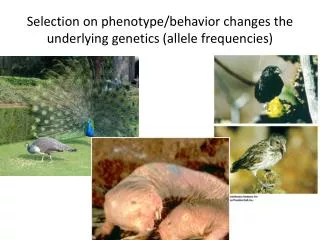
Changes in Allele Frequencies • 1. Natural Selection: the increase or decrease in allele frequencies due to the impact of the environment…but there are others • 2. Mutations: introduce new alleles that may provide selective advantages (although most mutations are deleterious)
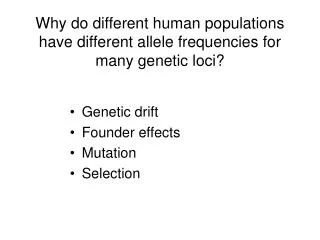
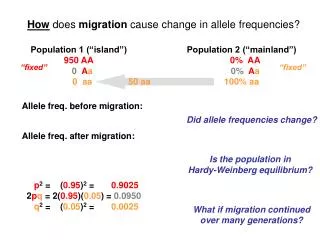
Changes in Allele Frequencies • 3. Gene Flow: describes the introduction or removal of alleles from the population when individuals leave (emigration) or enter (immigration) the population • 4. Genetic Drift: a random increase or decrease of alleles (by chance alone), especially in small populations (see next slide)
Genetic Drift • Analogy: flipping a coin • Out of 100 tosses: about 50 will be heads • Out of 5 tosses: ??? All could be tails by chance • Founder Effect: occurs when allele frequencies in a group of migrating individuals are, by chance, not the same as that of their population of origin • Example: polydactylism among Amish
Genetic Drift • Bottleneck: occurs when the population undergoes a dramatic decrease in size, the small population becomes severely vulnerable to genetic drift depending on the genetic diversity of the survivors • Example: Cheetahs
Changes in Allele Frequencies • 5. Nonrandom Mating: occurs when individuals choose mates based upon their particular traits • Examples: • Inbreeding: individuals mate with relatives • Sexual Selection: females choose mates based upon their attractive appearance or behavior or their ability to defeat other males in contests
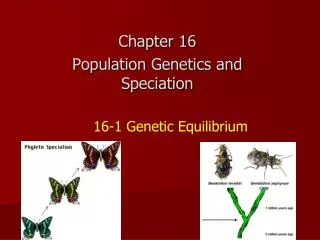
Genetic Equilibrium • When allele frequencies in a population remain constant from generation to generation, the population is said to be in genetic equilibrium…or • Hardy-Weinberg equilibrium • At equilibrium, no evolution occurs • No changes in allele frequencies
Genetic Equilibrium • Conditions (or assumptions): • All traits are selectively neutral (no natural selection) • Mutations do not occur • The population must be isolated from other populations (no gene flow) • The population is large (no genetic drift) • Mating is random
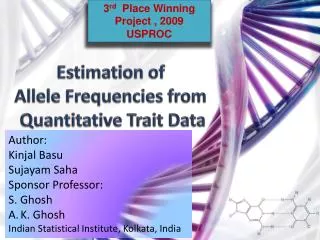
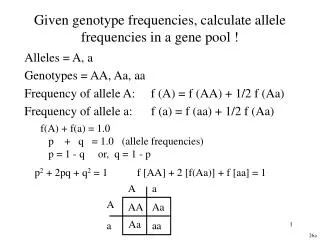
Genetic Equilibrium • Allele frequencies for each allele (p, q) • Frequency of homozygotes (p2, q2) • Frequency of heterozygotes (pq + qp = 2pq) • p + q = 1 (all alleles sum to 100%) • p2 + 2pq + q2 = 1 (all individuals sum to 100%)
Genetic Equilibrium • Example: suppose a plant population where 84% have red flowers and 16% have white flowers. Assume the red allele (R) is dominant to white (r): q2 = 0.16 = white flowered plants (rr) p2 + 2pq = 0.84 = red flowered plants (RR & Rr) To determine the frequency of the white flower allele, find q. Hint: square root of q2
Genetic Equilibrium q = √0.16 = 0.4 since p + q = 1 ; p must equal 0.6 You can also determine the frequency (or percentages) of individuals with the homozygous dominant and heterozygous condition:
Genetic Equilibrium Heterozygotes: 2pq = (2)(0.6) (0.4) = 0.48 or 48% Homozygous Dominant: p2 = (0.6)(0.6) = 0.36 or 36%
Practice • A population of deer mice consists of 25% of individuals with long tails, which is the dominant condition (T), and 75% of individuals with short tails (tt). • What is the allele frequency of the short tail allele? • What is the allele frequency of the long tail allele? • What is the frequency of individuals with the homozygous and heterozygous conditions? (Both)
Reality Check • In most natural populations, the conditions of Hardy-Weinberg equilibrium are not obeyed. What does this tell us? • However, these calculations can serve as a starting point to reveal how allele frequencies are changing, and which driving forces are changing them.