Download

1 / 16
160 likes | 326 Vues
3 rd Place Winning Project , 2009 USPROC. Estimation of Allele Frequencies from Quantitative Trait Data. Author: Kinjal Basu Sujayam Saha Sponsor Professor: S. Ghosh K. Ghosh Indian Statistical Institute, Kolkata, India. Introduction.

E N D
3rdPlace Winning Project , 2009 USPROC Estimation of Allele Frequencies from Quantitative Trait Data Author: Kinjal Basu Sujayam Saha Sponsor Professor: S. Ghosh K. Ghosh Indian Statistical Institute, Kolkata, India
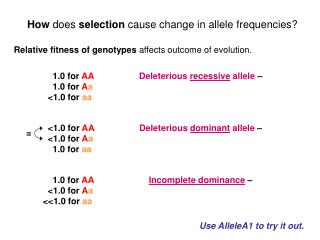
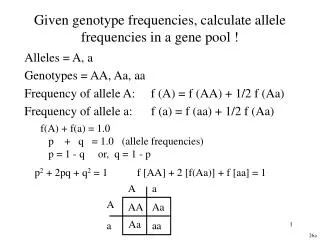
Introduction • The problem is of localization of a bi-allelic gene controlling a quantitative trait. • The (unknown) distribution of trait data depends on genotype, i.e. we have a mixture of 3 distributions each corresponding to a genotype. Statistics- An Integral Part of Genetic Research Our quest is to estimate p, the frequency of allele A, from a mixture distribution with mixing proportions p2, 2pq and q2, due to genotypes AA, Aa and aa.
Methodology -The way the pieces fall into place! • Cluster analysis gives us estimates which are used both on their own or as initial guesses for other methods. • For sake of algebraic simplicity, to begin with we assume the data to follow a mixture Gaussian Model . We test two methods-based on EM and CEM, respectively. • We next investigate two categories of departure from normality: a. Asymmetric Distributions b. Heavy-tailed Distributions
Cluster Analysis Using 3-Means algorithm we find the three clusters. Now we need to decide which cluster corresponds to which genotype. We connect the bigger of the extreme clusters to AA and the smaller one to aa. • If n1, n2 and n3 be the cluster sizes corresponding to AA, Aa and aa genotypes respectively, then the MLE of p is given by • p = (2n1 + n2) /2(n1 + n2 + n3)
Gaussian Model Analysis To analyze the data assuming an underlying mixture Gaussian distribution, we make use of EM and CEM algorithms using the posterior expectations of indicator variables given the data in E-step and the standard results for Gaussian Model in M-step (here mean and variance is interpreted as weighted mean and variance with the indicator variables as weights). A mixture of N(3,1) N(0,1) and N(-3,1) with p=0.45
Results Inference : • As the separation between the means increases the MSE decreases. • EM gives better results than 3-means. CEM is unsatisfactory. • As p approaches 1 the performance of all the methods detoriate. This is probably because the cluster corresponding to q2 vanishes at a quadratic rate.
Multivariate Model Assumption In multi-dimensioned data, treating each variable separately means information on interdependencies between the variables is not used at all. Thus, a vector-valued estimation algorithm is called for. We choose multivariate normal to model the data and use a multivariate analog of the theory in Slide 5 to estimate p. Result : Overall, EM was better than the other two methods. EM and CEM gave comparable MSE mostly, but their superiority over 3-means was not evident in some cases, especially for p=0.6.
Deviations from Normality i) Asymmetric Distributions Box Cox Transformations • Here we transform the original asymmetric data into a symmetric data by using an appropriate value of λ. • yoriginal (yλ – 1)/ λ if λ≠ 0 • ln(y) if λ = 0 • Criterion for choice of λ: • Maximizing between group to within group variance ratio. Log Normal Dist. to Normal Dist. by λ = 0 Chi Squares Dist. to Normal Dist. by λ = 0.5
Results Using a regular grid of points for λ we see that almost always (more than 95% time) the correct λ or a nearby value is chosen by the algorithm. Log Normal Inference : • The performance under different values remain similar under the variations, however there is a drop of performance due to the added variation for the choice of λ.
Deviations from Normality • Many heavy-tailed distributions such as Cauchy and T-2 do not have finite first two moments. In these cases we cannot use the sample mean and variance to estimate the location and scale parameters of the population • Instead we use sample median and quartile deviation to estimate the location and scale parameters. • Use of quantiles instead of moments also help increase the robustness of the algorithms towards outliers in the data. So this algorithm can also be used when robustness is required even though the distribution is not suspected to be heavy-tailed. ii) Heavy Tailed Distributions
3-Medoids The 3 clusters have comparable no of elements and actual classification has been done Using p=0.5, the classification should have been as 250, 500 and 250 The three clusters are of size 984, 15 and 1 The three clusters are of size 299, 421 and 280 Thus, 3-Medoids gives much better results in the presence of outliers. The Outlier and the single element of the cluster Comparing 3-Means and 3-Medoids 3-Means
Results Cauchy Distribution Inference : • The robust algorithms protect us from outliers messing with the estimates too much but at a cost of loss of efficiency of the EM algorithm
Collection and Analysis of Real Data • Data was collected from an ongoing clinical survey at Madras Diabetes Research Foundation, Chennai, India on Type 2 Diabetes from roughly 500 patients on 9 different fields. • Preliminary analysis revealed some perfect linear dependencies which helped us reduce dimensionality of the multivariate estimates. • We have run the data through both the univariate algorithms, each variable separately, and also the multivariate routine using 6 fields.
Results i) Results from multivariate Analysis: 3-medoids: 0.6857 EM: 0.6477 CEM: 0.6576 The consistency of the results shows that multivariate normal is a good fit for the data. ii) Result from univariate analysis
Discussions • We see that in phenotypes FBS-INS, IR, CHO, TRI and HDL , the estimate of p is almost consistent except for the EM and CEM Algorithms. The reason must be that the distribution does not follow a Gaussian Model or the data contained extreme outliers . • In LDL, robust EM and CEM give consistent values, but the initial cluster analysis does not, implying that though 3-medoids was not entirely accurate, that initial estimate yielded a consistent solution. • In BMI and FBS, we have consistent solution for EM and CEM algorithm but its sensitivity decreases during robustification. This implies that the underlying model is most likely Gaussian. • If some phenotypes return same p, and we have prior biological knowledge that their controlling genes may be same, it is probably true that the same gene controls those specific phenotypes. This work will immensely help in identifying those phenotypes.
Conclusion : Using the simulated result we propose the following method as the most optimum method for calculating the allele frequency : We first execute the 3-medoids algorithm to estimate the location and scale parameters of the 3 clusters and also a crude estimate of p. Using EM algorithm, starting with the crude estimates for a grid of λ values we choose the one with the maximum between to within variance ratio. We graphically check if the data contains outliers. If yes, we use the robust EM or else we follow the usual EM to get the final Estimate of p, the allele frequency. Sources : Madras Diabetes Research Foundation, Chennai, India http://www.mvdsc.org/mdrf/about.htm