Download
1 / 33
531 likes | 2.31k Vues
. Quantitative estimation of DNA and RNA. Estimation of nucleotides is the very important step after sample isolation to find out the amount of the nucleotide present and to check for the suitability of the sample for the further analysis. Related Loss: DNA properties

E N D
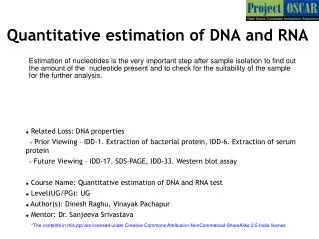
Quantitative estimation of DNA and RNA Estimation of nucleotides is the very important step after sample isolation to find out the amount of the nucleotide present and to check for the suitability of the sample for the further analysis. • Related Loss: DNA properties > Prior Viewing – IDD-1. Extraction of bacterial protein, IDD-6. Extraction of serum protein > Future Viewing – IDD-17. SDS-PAGE, IDD-33. Western blot assay • Course Name: Quantitative estimation of DNA and RNA test • Level(UG/PG): UG • Author(s): Dinesh Raghu, Vinayak Pachapur • Mentor: Dr. Sanjeeva Srivastava *The contents in this ppt are licensed under Creative Commons Attribution-NonCommercial-ShareAlike 2.5 India license
Learning objectives 1 After interacting with this learning object, the learner will be able to: • Describe the presence of DNA/RNA in the sample • Define the mechanism of detection • Operate the steps used in colorimetry • Infer the law governing the colorimetric analysis • Assess the troubleshooting steps involved in the experiments. 2 3 4 5
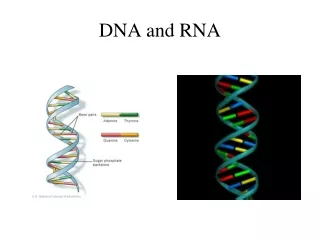
Definitions and Keywords 1 DNA: Deoxyribonucleic acid, contains the genetic information used in the functioning and development living organisms 2. RNA: are ribonucleic acid, chemical nature is very much similar to DNA, play an active role in cell signaling, carry out biological reactions and even control expression gene. 3. Ethidium bromide: a fluorescent tag binds reversible to DNA molecule which fluoresce with orange color when exposed to UV. 2 3 4 5
Master Layout 1 Slide 5-10 Gel Casting Slide 11-12 Making the standards and sample 2 Slide 13-15 Agarose gel electrophoresis Slide 16-18 3 UV transilluminator Slide 19-20 Making the standards and sample 4 Slide 21-26 Spectrophotometer Slide 26-29 Calculate the concentration 5
Step 1: T1:Gel casting 1 2 Beaker Magnetic bead 3 Description of the action Audio Narration (if any) Show magnetic stirrer instrument. Let user place the beaker on it. Display the beaker containing powder at bottom, liquid layer on top and a magnetic bead at the bottom. Instruct user to ON the instrument, let user cotrol the speed nob and regulate it accordingly to control the mixing speed in the beaker. Animate powder getting into the solution. Show a turbid solution turning colorless 4 The magnetic stirrer helps for a even mixing of solute Into the solvent at faster rate. 5
Step 1: T1:Gel casting 1 2 Measuring balance 3 Audio Narration (if any) Description of the action Show a measuring balance, with display, ON, OFF and TARE/0 buttons on it. let user ON it, display reading as 0.000g, let user picks up the paper from the rack, makes 1/10 of folding on the sides and places it on the balance. Now the display reading changes to 0.003g. Instruct user to TARE the reading. And animate to click the tare button. Once user clicks it, reading must show ”0” When measuing with paper, the weight of the paper need to be tared from actual reading. 4 5
Audio Narration Description of the action Step 2: T1: Gel casting 1 EDTA stock EDTA 2 Water 3 Instruct user to prepare “stock solution of EDTA” buffer, let user take out EDTA bottle from the rack and keep next to the balance. Let user weigh 93.05g of EDTA, transfer to a fresh beaker, measure and add 400ml of water to the beaker, let user makes a movement on the baker to dissolve the reagent into the solution. With the help of pH meter set the pH to 8.0 by adding NaOH and later make the volume to 500ml by water. Ethylenediamine tetra acetic acid (EDTA) stock need to be prepared in advance. 4 5
Audio Narration Description of the action Step 3: T1: Gel casting 1 TAE stock TRIS 2 Water 3 Instruct user to prepare “stock solution of TBE (50X)” buffer, let user take out tris base and glacial acetic acid bottle from the rack and keep next to the balance. Let user weigh 242g of Tris base, transfer to a fresh beaker, measure and add 750ml water to the beaker, let user makes a movement on the baker to dissolve the reagent into the solution and mixing done as in slide 5. Instruct user to measure and add 57.1ml of glacial acetic acid and 100ml of EDTA stock solution. Let user make up the volume to 1000ml by water. The stock solution of TBE(50X) can be stored at room temperature and pH adjustment is not required. For running the gel prepare 1X TBE buffer, which can be used for DNA quantification. 4 5
Audio Narration Description of the action Step 4: T1: Gel casting 1 TBE stock Tris 2 Boric acid 3 Instruct user to prepare “stock solution of TBE (5X)” buffer, let user take out tris base and boric acid bottle from the rack and keep next to the balance. Let user weigh 54g of Tris base, 27.5g boric acid, transfer to a fresh beaker, measure and add 900ml water to the beaker, let user makes a movement on the baker to dissolve the reagent into the solution. Instruct user to measure and add 20ml of EDTA stock solution. Let user make up the volume to 1000ml by water. The stock solution of TBE(5X) can be stored at room temperature and pH adjustment is not required. For running the gel prepare 10X TBE buffer, which can be used for RNA quantification. 4 5
Step 5: T1: Gel casting 1 Buffer 2 Gel solution Agarose Description of the action Audio Narration 3 Instruct user to take out agarose bottle from the rack and keep next to the balance. Let user weigh 320mg of agarose and transfer to a fresh 250ml conical flask. To the flask let user add 40ml of TBE buffer. Instruct user to take the conical flask for heating in oven for few seconds to dissolve the agarose by opening the oven and placing the flask and watching on the instrument. To the melted agarose add 0.5ug/ml of ethidium bromide. Label it as Gel solution. Ethidium bromide is a fluorescent dye interacts with base pairs of DNA/RNA and forms a complex. The complex get absorbed and emitted which can be acquired at visible spectrum. 4 5
Audio Narration Description of the action Step 6: T1: Gel casting 1 2 3 Instruct the user to put the gel solution into the gel casting unit. Place the gel casting unit, let user clean it with tissue, place the comb on top of it, pour the gel solution slowly. Keep the setup for 30min. Events must happen when the user clicks on the hand. Show a change from liquid to solid state Place the gel casting unit, depending upon the sample user can place the comb for the wells. Pour the gel solution into the unit, avoid air bubbles. 4 5
Audio Narration Description of the action Step 7: T2: Making the standards and sample 1 2 3 Once the gel is cast, let user place the gel in the running unit, pour the 1X buffer to the required level. Add the running buffer to the unit with the required concentration. 4 5
Audio Narration Description of the action Step 8: T2: Making the standards and sample 1 2 3 Instruct the user to prepare sample and standard for the loading. Let user take out the dye, sample and DNA/RNA standards from the freezer, keep it on ice for 5min. In each well, let user mix 1ul of loading dye(blue in color) with 2-3ul of sample/standard. Animate the step, for user taking a pipette setting it to 1ul, taking out dye, pipette it on parafilm. Now similarly take out sample/standard with pipette, mix it with the dye solution on the paraffin with pipette, after mixing load in the required well and let user make a note of it. The dye and the sample/standard need to be mixed at proper ratio before loading into the gel. The mixing step can be done on parafilm or on eppendrof tube cap. Try to load standards in the first well if possible followed by sample. 4 5
Audio Narration Description of the action Step 9: T3: Agarose gel electrophoresis 1 2 3 Let user connect the run unit to power supply, let user make proper connection, check for the buffer level, anode and cathode wiring. Make the voltage set for 70V and click “ON” button. Animate small bubbles coming from the electrode and movement of the blue bands as time passes. Set the required voltage, have a regular check for the buffer level. 4 5
Audio Narration Description of the action Step11: T3: Agarose gel electrophoresis 1 2 3 Animate the movement of bands to the 1/3 of the distance of the gel. Instruct user to stop the unit, with help of gloves let user open the lid of the running unit, pick up the gel and take it for UV check. After bands have been resolved in the gel, the gel can be taken for UV visualization. 4 5
Audio Narration Description of the action Step12: T4: UV transilluminator 1 2 UV instrument Gel on UV platform gel view under UV Scanned image 3 Show the UV instrument connected to monitor. Let user place open the UV platform drawer, place the gel on the UV platform, close it, let user On the UV light. click on the UV software popup a window, with File, view, edit, save options. Let user click on view>pre-scan. Animate a small window with image appearing row by row to show the scanned image. Animate user to look at the real image, with bands glowing like in gel view under UV. Provide a option for save image, when the scan is completed. Let user name the file accordingly. Scan the image at required parameters settings. Let user makes a note of the bands and the readings by saving the file. 4 5
Audio Narration Description of the action Step13: T4: UV transilluminator 1 2 3 Please re-draw the above figure. Figure “a” represents the ethidium bromide. Animate in figure “b” DNA molecule coming in contact with ethidium bromide(small beads) getting stacked between base pairs. Ethidium bromide is a fluorescent dye interacts with base pairs of DNA/RNA and forms a complex. The complex get absorbed and emitted which can be acquired at visible spectrum. 4 5
Audio Narration Description of the action Step14: T4: UV transilluminator 1 2 Scanned image 3 Animate the steps, user doing the analysis on the scanned image by taking through the IDD for SDS-PAGE gel analysis. The analysis on the scanned image of the sample bands can be quantified by comparing with that of the standards. If the sample bands run along the standard bands and are seen at the same position, we can say that sample contains the DNA/RNA of interest. If there are no bands within the marker run length, we say no presence of DNA/RNA in the sample. 4 5
Audio Narration Description of the action Step15: T1: Making the standards and sample 1 TAE stock TRIS 2 Water 3 Instruct user to prepare “stock solution of TAE (50X)” buffer, let user take out tris base and glacial acetic acid bottle from the rack and keep next to the balance. Let user weigh 242g of Tris base, transfer to a fresh beaker, measure and add 750ml water to the beaker, let user makes a movement on the baker to dissolve the reagent into the solution. Instruct user to measure and add 57.1ml of glacial acetic acid and 100ml of EDTA stock solution. Let user make up the volume to 1000ml by water. The stock solution of TAE(50X) can be stored at room temperature and pH adjustment is not required. For running the gel prepare 1X TAE buffer, which can be used for DNA quantification. 4 5
Audio Narration Description of the action Step16: T1: Making the standards and sample 1 2 3 Instruct user to take out the sample from the -20’C freezer, place them on ice for thawing for 5min. Let user set the pipeete to 1000ul to take out TAE buffer and transfer to fresh tube, label it as “BLANK”. Let user set the pipette to 10ul to take out the sample in fresh tube, now let user set the pipette to 900ul to add TAE buffer to the tube and label it as “SAMPLE”. Let user close the tube and vortex the tube for proper mixing. Sample for the quantification of DNA must be taken out. After dilution with buffer give a short vortex to mix the solution. Now the solution is ready for the spectrometer reading. 4 5
Step 17: ) T2:: UV-Visible spectrophotometer 1 Display Options like number 0-9, set wavelength, autozero, absorbance 2 Lid that can be opened 3 cuvette 4 5
Description of the action Audio Narration Step 17: T2:: UV-Visible spectrophotometer 1 Animate the instrument as in figure and redraw the instruments with the specification mentioned in the figure and zoom the instrument and show a schematic as shown in the figure with the labelings but redraw completely UV-Visible spectrophotometer has a monochromator, light source and sample holder and detector, Light from the source are converted to a monochromatic light of particular wavelength and allow it pass through the sample and amount of light that emerges is detected by a detector. 2 3 4 5
Audio Narration Description of the action Step 17: T2: Spectrophotometer 1 2 3 Absorbance of a sample that is nothing but logarithm ratio of incident light to reflected light is equal to the product of path length, epsilon constant and concentration of the solution. Form the above equation one can calculate the concentration of the solution given the incident light, reflected light and path length value. Animate the above display, like Io passing through the sample of concentration ‘c’, travelling a path length “l” and coming out as ‘I’. Now animate putting these parameters in the equation above for user click to explain accordingly. 4 5
Description of the action Audio Narration Step 18: T2: Spectrophotometer 1 Let the user take the tube 1 and take 2 cuvettes as in figure . Instruct the user to press the open lid show two opening inside it one after the other in longitudinal way. Show like pouring the contents from tube 1 to both the cuvettes , show like taking the tissue and wiping on the sides and placing it in the openings, now animate like closing the lid and press absorbance . (before keeping the cuvette the reading should be 0.000, once the cuvette is kept and “absorbance is pressed it should be 0.123) Now instruct the user to press”auto zero” and the reading should be 0.000 and remove the cuvettes by opening the lid and taking out the cuvette from opening 2 throw the solution out from the cuvette Auto zero and callibrate the instrument using the control solution without hydrogen peroxide 2 3 4 5
Audio Narration Description of the action Step 22: T2: Spectrophotometer 1 Set the instrument at 280nm to set it at auto zero with buffer and taking the reading for the same sample at 260nm. Repeat the same steps like in slide:25 to set the instrument at 280nm. This time animate the reading of the sample around 2.3. let user makes a note of the reading. Also user should take reading at 260nm. 2 3 4 5
Audio Narration Description of the action Step 24: T3: Calculate the concentration 1 • A ratio value between 1.8-2.0 denotes, presence of nucleic acids. • A ratio value lower than 1.8 denotes presence of proteins and/or other UV absorbers. • A ratio value higher than 2.0 indicates that the samples may be contaminated with chloroform or phenol. • In either case (<1.8 or >2.0) it is advisable to re-precipitate the DNA. Instruct user to do the ratio calculation of 260/280. animate the ration being displayed on the screen with audio narration. 2 3 4 5
DNA concentration (g/ml) =OD260 x 100 (dilution factor) x 50 g/ml 1000 • DNA concentration (g/ml) =OD260 x 100 (dilution factor) x 50 g/ml 1000 • DNA concentration (g/ml) =OD260 x 100 (dilution factor) x 50 g/ml 1000 • DNA concentration (g/ml) =OD260 x 100 (dilution factor) x 50 g/ml 1000 Audio Narration Description of the action Step 25: T3: Calculate the concentration 1 DNA concentration (ug/ml) = OD at 260 x 100 (dilution factor) x 50 ug/ml 1000 2 3 DNA concentration can be calculated by the above formula. Instruct user to do the DNA concentration calculation. animate the calculation being displayed on the screen with audio narration. 4 The calculated concentration can now taken for further analysis, for more information look for future IDD. 5
Button 01 Button 02 Button 03 Slide 13-15 Slide 16-18 Slide 5-10 Slide 11-12 Tab 01 Tab 02 Tab 03 Tab 04 Tab 05 Tab 06 Tab 07 Name of the section/stage Animation area In slide-17: provide user a gel image with bands in sample well appearing after the DNA standards bands. Let user interrupt the result? Instruction: user must come out with the solution pointing out presence of proteins and no DNA/RNA in the sample. Must go back to sample extraction step to make the changes. Interactivity area Instructions/ Working area Credits
Button 01 Button 02 Button 03 Slide 26-29 Slide 19-20 Slide 26-29 Slide 21-26 Slide 19-20 Slide 19-20 Slide 21-26 Slide 21-26 Tab 01 Tab 02 Tab 03 Tab 04 Tab 05 Tab 06 Tab 07 Name of the section/stage Animation area Interactivity area Instructions/ Working area Credits
Questionnaire: APPENDIX 1 Question 1 Native DNA, molecular weight Greater than (40 kb) less than (40 kb) Greater than (20 kb) Greater than (80 kb) Question 2 the bound dye itself absorbs radiation at a) 366nm b) 460nm c) 480nm d) 302nm and 366nm Question 3 The visible spectrum of DNA-Dye complex falls in Orange region reddish-orange region Red region Yellow region
Questionnaire: APPENDIX 1 Question 4 In either case 460/480 ratio value (<1.8 or >2.0) re-precipitate the sample. precipitate the sample. Mix the sample Add buffer Question 5: As the absorbance increases , the intensity of the outgoing light Decreases Increases Remains same zero
APPENDIX 2 Links for further reading • Reference websites: http://www.youtube.com/watch?v=6mQGNDnOyH8&feature=related Book Hoisington, D. Khairallah, M. and Gonzalez-de-Leon, D. (1994). Laboratory Protocols: CIMMYT Applied Biotechnology Center. Second Edition, Mexico, D.F.: CIMMYT.
APPENDIX 3 Summary The method mostly involves the quantitative and qualitative estimation of DNA/RNA using absorbance ratio method and by agarose electrophoresis. The quantification and estimation of the DNA/RNA can be depend lot on standards and gel concentration used.