CART Model for Ozone Forecasting in Treasure Valley Using EPA Guidelines
180 likes | 268 Vues
Develop effective ozone forecasts for Treasure Valley using CART model. Utilize 8-year ozone and meteorological data to predict pollutant concentrations. Enhance accuracy and reliability for AQI and Crop Residual Burning forecasts. Evaluate model performance and address limitations for future improvements.

CART Model for Ozone Forecasting in Treasure Valley Using EPA Guidelines
E N D
Presentation Transcript
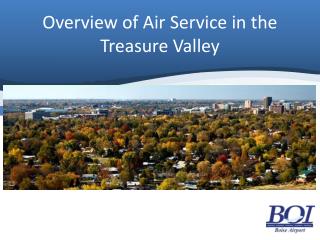
Forecasting Ozone in Treasure Valley using CART Idaho DEQ June 3, 2011
Forecasting for AQI and CRB • Daily AQI forecast for public • Daily AQI forecast for residential burning bans (AQI<60 outdoor, AQI <74 all burns) • Forecast for Crop Residual Burning • Regional offices utilize AIRPACT, WRF data, apply various methods for the forecasting • Need more reliable, easy to use tools
CART Model • Classification And Regression Tree (CART) is a statistical procedure designed to classify data into dissimilar groups. • CART helps to develop a decision tree to predict pollutant concentrations based predictor variables that are well correlated with pollutant concentrations.
Forecasting Methods From Guidelines for Developing an Air Quality (Ozone and PM2.5) Forecasting Program. EPA-456/R-03-002 June 2003
Data • Eight year ozone data (2001-2008) • Eight year meteorological data including surface data and upper air data: temperature, wind, humidity, pressure, etc. • WRF forecasting data
Positive correlation Correlation Table No correlation Negative correlation
CART tree for Treasure Valley Ozone Forecasting (1) Observation Data: Year 2001-2008, May-Aug G=Green 0-59ppb Y=Yellow 60-75 ppb O=Orange 76-95ppb R=Red 96-115ppb P-Purple 116-374ppb
G=Green 0-59ppb Y=Yellow 60-75 ppb O=Orange 76-95ppb R=Red 96-115ppb P-Purple 116-374ppb CART tree for Treasure Valley Ozone Forecasting (2) Observation Data: Year 2001-2008, May-Aug
Source of Errors • Small changes near the split point may end larger errors. • Bias in the meteorological forecast. • Emission changes. e.g. Holidays, economy driven sources. • Boundary conditions. e.g. Stratosphere intrusion (ST) due to stratosphere-troposphere exchange (STE); long range transport.
An unusual Ozone Episode in May 2011Graphs From AIRPACT Conditions on May 15, 2011 in Treasure Valley: A cold front was reaching the area Max temperature ~ 53°F, breezy, rain Max 8hour average O3 reached 63ppb in early afternoon, the highest in the month.
Warm (~80’s °F) and Dry Monthly average relative humidity was 26.7% Average 6 year Relative humidity in May is 38.4%. (average from 10:00am-6:00pm)
CART- Limitations • Requires large set of data, a modest amount of expertise and effort to develop. • Small changes in predictor variables may produce large changes in the predictions. • Does not predict unusual events. • Requires periodic updates due to emission and land use changes.
Future Work • Improve the model for Boise • Experiment for Coeur d’Alene • Explore more parameters • Study for unusual events.