Spin-Spin Splitting
Spin-Spin Splitting. At higher resolution, we see that the -CH 2 and -CH 3 peaks are split: Why? shielding is also affected by nuclear spin orientations of protons on adjacent carbons. Let’s look at this in more detail!. Chemistry Department, University of Isfahan.

Spin-Spin Splitting
E N D
Presentation Transcript
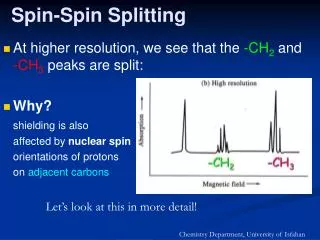
Spin-Spin Splitting • At higher resolution, we see that the -CH2 and -CH3 peaks are split: • Why? shielding is also affected by nuclear spin orientations of protons on adjacent carbons Let’s look at this in more detail! Chemistry Department, University of Isfahan
More Spin-Spin Splitting • CH3 Protons • split by the spins of the 2 adjacent CH2 protons: ↑↑↓↑ ↓↑↓↓ 1 2 1 3 peaks • CH2 Protons • split by the spins of the 3 adjacent CH3 protons: ↑↑↑↑↑↓ ↑↓↑ ↓↑↑↓↓↑ ↓↑↓ ↑↓↓↓↓↓ 1 3 3 1 4 peaks Chemistry Department, University of Isfahan
Quantifying Spin-Spin Splitting • Spin-spin splitting is quantified by: J: Coupling Constant • Jis reported in absolute units (frequency, Hz) and is typically 1-20 Hz • Jdepends only on the electronic and steric relationships between interacting nuclei • Thus, Jis independent of spectrometer B0 Chemistry Department, University of Isfahan
Spin-Spin Coupling • Nuclei experiencing the same chemical environment or chemical shift are called equivalent. • Those nuclei experiencing different environment or having different chemical shifts are nonequivalent. • Nuclei which are close to one another exert an influence on each other's effective magnetic field. • This effect shows up in the NMR spectrum when the nuclei are nonequivalent. • If the distance between non-equivalent nuclei is less than or equal to three bond lengths, this effect is observable. This effect is called spin-spin coupling or J coupling. Chemistry Department, University of Isfahan
Spin-Spin Coupling • Consider A and B, which are three bonds away from one another in a molecule. • The spin of each nucleus can be either aligned with the external field the fields are N-S-N-S, called spin up or opposed to the external field The fields are N-N-S-S, called spin down The magnetic field at nucleus A will be either greater than B0 or less than B0 by a constant amount due to the influence of nucleus B. Chemistry Department, University of Isfahan
Spin-Spin Coupling • The NMR spectrum for nuclei A and B reflects the splittings observed in the energy level diagram. • The A absorption line is split into 2 absorption lines centered on A, and the B absorption line is split into 2 lines centered on B. • The distance between two split absorption lines is called the J coupling constant or the spin-spin splitting constant and is a measure of the magnetic interaction between two nuclei. Chemistry Department, University of Isfahan
Spin-Spin Coupling • For the next example, consider a molecule with three spin 1/2 nuclei, one type A and two type B. • The type B nuclei are both three bonds away from the type A nucleus. • The magnetic field at the A nucleus has three possible values due to four possible spin configurations of the two B nuclei. Chemistry Department, University of Isfahan
Spin-Spin Coupling • The magnetic field at a B nucleus has two possible values. • The energy level diagram for this molecule has six states or levels because there are two sets of levels with the same energy. • Energy levels with the same energy are said to be degenerate. The vertical lines represent the allowed transitions or absorptions of energy. • Note that there are two lines drawn between some levels because of the degeneracy of those levels. Chemistry Department, University of Isfahan
Spin-Spin Coupling • The resultant NMR spectrum is depicted in the animation window. • Note that the center absorption line of those centered at A is twice as high as the either of the outer two. • This is because there were twice as many transitions in the energy level diagram for this transition. The peaks at B are taller because there are twice as many B type spins than A type spins. Chemistry Department, University of Isfahan
Spin-Spin Coupling • The complexity of the splitting pattern in a spectrum increases as the number of B nuclei increases. The following table contains a few examples. This series is called Pascal's triangle and can be calculated from the coefficients of the expansion of the equation: (x+1)n where n is the number of B nuclei in the above table. Chemistry Department, University of Isfahan
Spin-Spin Coupling • When there are two different types of nuclei three bonds away there will be two values of J, one for each pair of nuclei. • By now you get the idea of the number of possible configurations and the energy level diagram for these configurations, so we can skip to the spectrum. • In the following example JAB is greater than JBC. Chemistry Department, University of Isfahan
Effects of Magnetic Field on Spectrum? J: unaffected δ: unaffected Resolution: (Hz / ppm) ∝ B0 Chemistry Department, University of Isfahan
CH3CH2OHA ( ) + HOHB ( ) CH3CH2OHB ( ) + HOHA ( ) CH3CH2OHA ( ) + HOHB ( ) CH3CH2OHB ( ) + HOHA ( ) CH3CH2OHA ( ) + HOHB ( ) CH3CH2OHB ( ) + HOHA ( ) CH3CH2OHA ( ) + HOHB ( ) CH3CH2OHB ( ) + HOHA ( ) Chemical Exchange
NMR Solvents Chemistry Department, University of Isfahan
13C-NMR Spectroscopy • Each nonequivalent 13C gives a different signal • A 13C is split by the 1H bonded to it according to the (n + 1) rule • Coupling constants of 100-250 Hz are common, which means that there is often significant overlap between signals, and splitting patterns can be very difficult to determine • The most common mode of operation of a 13C-NMR spectrometer is a hydrogen-decoupled mode
13C-NMR Spectroscopy • In a hydrogen-decoupled mode, a sample is irradiated with two different radio frequencies • one to excite all 13C nuclei • a second is a broad spectrum of frequencies that causes all hydrogens in the molecule to undergo rapid transitions between their nuclear spin states • On the time scale of a 13C-NMR spectrum, each hydrogen is in an average or effectively constant nuclear spin state, with the result that 1H-13C spin-spin interactions are not observed; they are decoupled
Continuous-Wave NMR “Block diagram of Continuous-Wave NMR.” Dr. S. M. Condren
Instrumentation - CW-NMR R-F transmitter R-F receiver & detector sample magnet recorder Dr. S. M. Condren
Instrumentation CW-NMR R-F transmitter • irradiate sample with resonant radio frequency • less than 1 W output but reproducible to 1 part in 109 Dr. S. M. Condren
Instrumentation CW-NMR R-F receiver & detector • detect the radio frequency • amplify 105 times • integrator Dr. S. M. Condren
Instrumentation CW-NMR sweep generator => sweep coil • modify the applied magnetic field • “scans” through slight (ppm) changes in magnetic field which produces variations in position of resonant frequency • modifies magnetic field to give spectrum Dr. S. M. Condren
Instrumentation CW-NMR sample • sample suspended between pole faces of magnet • sample is spun • air driven turbine - average out effects of in homogeneities in the field • 5 mm O.D. tube Dr. S. M. Condren
Instrumentation CW-NMR magnet • causes the nuclear spin states to split • allows sample to absorb energy equal to the difference between spin states • most expensive component • must be reproducible & homogeneous Dr. S. M. Condren
Magnets type of magnet max. field strength permanent 14,092 G conventional electromagnet 23,490 superconducting solenoids <169,000 Dr. S. M. Condren
Magnets type of magnet max. field strength permanent 1.41 T conventional electromagnet 2.35 superconducting solenoids <16.9 Dr. S. M. Condren
Sample Handling • solution • solvents should be free of hydrogen • deuterated solvents used where necessary • should contain standard • most commonly tetramethyl silane (TMS) • TMS signal position set at 0 ppm • other peaks relative to TMS Dr. S. M. Condren
FT-NMR Dr. S. M. Condren
Components of FT Spectrometers "Block diagram of a Fourier transform NMR spectrometer." Dr. S. M. Condren
Magnet • in the past, electromagnets or superconducting solenoids • today, permanent magnets or superconducting solenoids Dr. S. M. Condren
Locking the Magnetic Field • field/frequency lock system • reference nucleus is continuously irradiated and monitored at a frequency corresponding to its resonance maximum at the rated field strength of the magnet • provided by deuterium in the solvent, with second transmitter coil set to the frequency for deuterium Dr. S. M. Condren
Shimming • coils which provide some changes in the magnetic field by carefully controlling the current flowing through the coils • used to correct for inhomogeneities of magnet Dr. S. M. Condren
Sample Spinning • sample is spun along its longitudinal axis to counteract some of the field inhomogeneities • "A minor disadvantage of spinning is that the magnetic field is modulated at the spinning frequency, which may lead to sidebands on each side of absorption peaks?" Dr. S. M. Condren
Sample Probe 1. holds sample in the magnetic field 2. spins the sample 3. houses the coil or coils that permit excitation and detection of the NMR signal and preamp 4. coil for locking 5. coil for decoupling 6. variable temperature capability Dr. S. M. Condren
Transmitter/Receiver Coils • early instruments, separate coils, at right angles to each other • FT-NMRs, normally same coil Dr. S. M. Condren
Pulse Generator 1. a continuous crystal oscillator 2. a gate to switch the pulse on and off 3. a power amplifier to amplify the pulse to perhaps 50 - 100 W Dr. S. M. Condren
Receiver System • nanovolt - microvolt signal amplified to 10 V Dr. S. M. Condren
Detector and Data Processing System • high-frequency radio signal converted to audio-frequency signal to digitized • carrier signal with superimposed NMR signal, 10 ppm PMR spectrum at 270 MHz would have a frequency range of 2700 Hz • subtract the carrier signal from NMR signal Dr. S. M. Condren
Sampling the Audio Signal digitize signal, must sample signal at least twice per cycle Dr. S. M. Condren
Single-Channel Detection disadvantage, does not know if difference between carrier signal and NMR signal is positive or negative, can produce a false signal Dr. S. M. Condren
Quadrature Detection Systems • NMR signal is split and fed to two identical detectors • in one detector the signal is treated in the normal manner, carrier signal subtracted from NMR signal for digitizing • in the second detector the carrier signal is altered 900 before subtraction Dr. S. M. Condren
Quadrature Detection Systems • the two audio signal are the same except for phase, the first produces a cosine wave while the second produces a sine wave • the two signals are digitized, transformed separately into frequency domain signals and combined to produce the spectrum • folded signal disappears because it is of opposite sign in the cosine and sine wave forms Dr. S. M. Condren