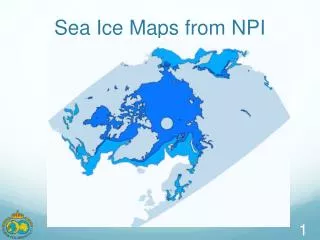
Sea Ice Maps from NPI
200 likes | 411 Vues
Sea Ice Maps from NPI. Maps produced. 30-year Maximum (for every month ) Areas where at least one day ice last 30 years 30 year Minimum (for every month ) Areas where Every single day ice last 30 years Ice Persistency ( Isfrekvens )

Sea Ice Maps from NPI
E N D
Presentation Transcript
Mapsproduced • 30-year Maximum (for everymonth) • Areas where at leastonedayice last 30 years • 30 year Minimum (for everymonth) • Areas whereEvery single dayice last 30 years • Ice Persistency (Isfrekvens) • Percentageof Days havingice last 30 years
Output in TwoProjections • NSIDC EPSG:3411 and North Pole LAEA Europe EPSG:3575
Basedon NSIDC data • Sea Ice Concentrations from Nimbus-7 SMMR and DMSP SSM/I-SSMIS Passive Microwave Data • 25 km • 26 October 1978 – most current processing • Daily
Filtering NSIDC Data • Original NSIDC data containserroneouspixels at coast line • At coast, usuallyvalues less than 15% ice • Still, thesepixelscauseerror in long-term maximumicemap • Solution: Filteringbasedon area
Filtering NSIDC Data • The following is applied to everydaily NSIDC file: • Step 1: Whole area: Pixelis consideredicewhen present day is ice AND daybefore or after is ice. • Step 2: In addition, Norwegian coast (defined by mask) onlyiceif present dayice and twodaysbefore and afterice as well • Step 3: The Baltic and somecoastal areas iceifpresent dayice and twodaysbefore and afterice as well • Step 4: Areas between UK and Lofoten, inland lakes and Pacific never considered to be ice • This mask can be adjusted to filter some areas in a specialway
FilteringResult – Consecutive Days • Purple area filteredawaywhenonlyiceconsideredifprevious or nextdayalsoice
FilteringResult • Results shows howthe pink maximum line excludescoastal areas and noise
FilteringResult • No Filtering at all versus filtering … biggestdifference in October • Many non-consecutiveicepixels in boundaryzone
Create Max / Min Maps • Create a NumberOfDay Raster • Loop through all files and add «1» whenvalue > 38 ( 15.2%) • Maximum Map shows where at leastonedayice in wholeperiod: • No icewhereNumberOfDay - Raster is zero, otherwiseice • Minimum Map shows whereevery single day in periodice: • Ice whereNumberOfDay – Raster valueequals total numberofdays-
Create Ice Persistency • In everypixelthepercentageofdayswithice cover > 15% • Calculation: • Loop througheach file • If ice in pixel, add 100/NumberOfDays to persistence raster
Filter Noise in Max/Min maps • Remove singular pixelsusinggdal_sieve filter • Possibility to adjust parameters! • Patches in front ofmaximumextent is removed by choosingthelargest polygon • Baltic is alsoremoved, butadded and treatedseparately
Convert Polygon to Line • Convert polygon to line and subtractcoastline to have iceedgeonly
Smooth Lines • QGIS GeneralizerPlug-In with snakes filter givesgood line-fit • Beziersmoothing in ArcGISremovesanyedges
Smoothed Lines • Comparison to published and previouslycalculated (Gunnar’sMatlab script)
Ice PersistencyCompared • ComparingGunnar’sMatlab and Python script
Alaska Japan China • East Chinese Sea / Yellow Sea has ice in persistence and maximummap from ouralgorithm • NSIDC mapindicatesthatthis is «real»
Python Script • Availableat https://github.com/npolar/RemoteSensing/tree/master/IcePersistency • Script is documentedwithinthecode • Steps: • 1) Run Script • 2) Manually: Apply snakes filtering QGIS • 3) Manually: ApplyBeziersmoothingArcGIS