Analysis of CD3 Positive Cell Counts and TEWL Levels in Experimental Conditions
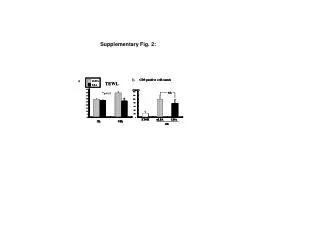
This study explores the quantitative analysis of CD3 positive cell counts measured in nLBA and LBA settings. Data includes variations across multiple time points (0h and 48h) and various ETOH concentrations. Significant statistical findings indicate p-values < 0.01 in certain conditions, revealing the impact of these variables on immune cell activation and skin barrier function. The results are intended to inform further research into immunological responses and their clinical implications.

Analysis of CD3 Positive Cell Counts and TEWL Levels in Experimental Conditions
E N D
Presentation Transcript
CD3 positive cell counts nLBA nLBA LBA LBA (/mm (/mm (/mm ) ) ) 45 45 2 2 2 1400 1400 1400 1400 NS 40 40 35 35 1200 1200 1200 1200 * 30 30 1000 1000 1000 1000 25 25 800 800 800 800 20 20 600 600 600 600 15 15 400 400 400 400 10 10 200 200 200 200 5 5 0 0 0 0 0 0 ETOH ETOH nLBA nLBA LBA LBA 0h 0h 48h 48h OX OX Supplementary Fig. 2: b CD3 positive cell counts CD3 positive cell counts a nLBA nLBA TEWL TEWL LBA LBA (/mm (/mm ) ) 45 45 2 2 * * 1400 1400 NS NS 40 40 p<0.01 p<0.01 35 35 1200 1200 * * 30 30 1000 1000 25 25 800 800 20 20 600 600 15 15 400 400 10 10 200 200 5 5 0 0 0 0 ETOH ETOH nLBA nLBA LBA LBA 0h 0h 48h 48h OX OX