Mastering the Scientific Process: Experiment Design and Analysis
80 likes | 109 Vues
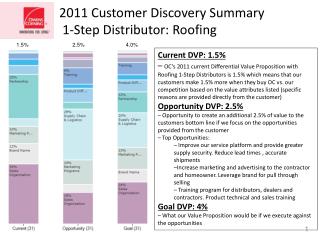
Learn the scientific process steps, deductive logic, experiment elements, and statistical tests. Explore controlled vs. comparative experiments and the value of the null hypothesis. Discover the Tyrone Hayes case study on gonadal abnormalities in frogs.

Mastering the Scientific Process: Experiment Design and Analysis
E N D
Presentation Transcript
1.5 1. Scientific Process 5 Steps • Make observations • Ask a question • Form a hypothesis to answer the question • Make a prediction based on a true hypothesis • Design and conduct an experiment that uses quantifiable data to test your prediction What happens after #5?
1.5 2. Deductive Logic, Relationship between observation, hypothesis design, and prediction • Starts with a statement believed to be true and goes on to predict what facts would also have to be true to be compatible with that statement. • Hypothesis design is based on your observations and your prediction is based on a true hypothesis
1.5 3. What are the elements of a well designed, controlled experiment? List and define. • Independent variable – variable that is manipulated in an experiment • Dependent variable – variable that responds to the manipulative variable in the experiment • Constants – all other variables in an experiment which must stay the same * See syllabus packet
1.5 4. Explain difference between controlled experiment and comparative experiment Controlled Comparative Comparing groups or samples Do not control variables • 1 manipulative variable • All other variables are the same
1.5 5. Explain the value of a statistical test and the null hypothesis • Statistical tests calculate the probability that the differences observed between measurements could be due to random variation. • Null hypothesis tests that there is no effect. It is the premise that any observed differences are simply the result of random differences
1.5 6. Tyrone Hayes Case • Dependent variable – gonadal abnormalities % in male frogs. Independent variable – amount of atrazine (ppb) • Constants – tanks, same type of tadpoles, amount of tadpoles in each tank • Graph used – bar graph
6. continued…d. Environmental factors • Other toxins at the site – cannot control what was already present in the water • DNA – cannot control genes and their expression or mutations that may result • Any others? *Scientists could run other experiments to see if these variables alone are causing abnormalities.