EarthScope GPS Tutorial: Principles, Data Access, and Applications
This tutorial provides an introduction to GPS principles, achieving high precision GPS results, GPS science examples, PBO instrumentation and data, and global PI research projects.

EarthScope GPS Tutorial: Principles, Data Access, and Applications
E N D
Presentation Transcript
EarthScope GPS Tutorial PBO Geodetic Instrumentation – GPS Principles, Data Access and Applications Chuck Meertens, David Phillips, Freddy Blume, Mike Jackson, and Greg Anderson UNAVCO, Boulder, CO EarthScope in the Northern Rockies Workshop Bozeman, Mt 17 September 2005
Outline • Science Introduction • GPS – Briefly how it works • Achieving High precision GPS results • GPS Science Examples • PBO Instrumentation and Data • GEO-EarthScope
GPS Science: Global PI Research Projects UNAVCO Facility-supported PI science includes plate tectonics, boundary zones, earthquakes and tectonics, volcanoes and active magmatic systems, glacial movements and isostatic adjustment, delta subsidence and precision mapping.
GPS – the global perspective Global Plate Motions and Boundary Zones ObservedGPS Velocities Plate Tectonic Model with Deformable Boundaries Model Velocities and Plate Boundary Strain 5170 geodetic velocities from 86 different studies GSRMModel of Kreemer and Holt
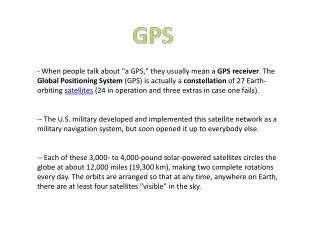
Space Segment GPS: The System and How it works • 24+ satellites • 6 orbital planes • 55 degrees inclination • 20,200 km altitude • 4 satellites in each plane • 12 hour orbital period • 4 satellites visible
Carrier C/A-code P-code NAVDATA Received Signal Satellite Signal Structure What your Geodetic GPS receiver measures… Carrier phase L1 L2 Frequency 1575.42 MHz 1227.60 MHz Wavelength 19cm 24cm Code Modulation C/A-code L2C-Coming… P(Y)-code P(Y)-code NAVDATA NAVDATA
Code Range Results Your location is: 45o 30.323’ N 111o 45.162’ W Autonomous Position +/- 10 m (30 ft) error (horizontal) +/- 15 m (45 ft) error (vertical)
N D Dl Carrier Phase Solutions • For highest precision (mm-level) coordinates use: • Carrier phase to determine ranges • Dual-frequency receivers • Good monuments • Multiple stations • Sophisticated processing software • Collect lots of data Dl = First Partial Wavelength N = Integer Ambiguity Distance D = Nl + Dl PBO Precision ~1 mm horizontal ~ 3-4 mm vertical From daily solutions
Reference Systems You also need Global Tracking Systems for: • Precise Orbits • Reference Frames (ITRF and SNARF) • Earth orientation parameters • Global Plate Motions and other geophysical effects NASA Global GPS Network (GGN) Operated by JPL and UNAVCO – get products from the IGS
Reference Frames – ITRF/SNARF Standard North American Reference Frame (SNARF) - UNAVCO SNARF Working Group, Geoff Blewitt, Chair Will provide an improved reference frame that accurately defines the precise coordinates and time evolution of a set of stations representing "stable North America." ITRF 2000 Velocities (left) compared to a N.America-fixed Reference frame (WUSA, SAO, right)
Permanent Stations Why Permanent Stations? 1. Improved precision and ability to assess precision • Longer time series • Tendency to invest in better monuments • Better able to characterize error sources 2. Measure transient phenomena • Earthquakes (co-seismic and high-rate), post-seismic, interseismic • Volcano deformation • Subduction zone aseismic transients • Hydrologic signals • Post-glacial rebound 3. Improved reference frame 4. Essential for orbits and clocks 5. Economy • Processing, data handling automated • Fewer personnel in field 6. Synergism with other applications (e.g. ATM, Surveying)
Global Plate Tectonics Global GPS data are used to construct plate tectonic and strain rate models Example: REVEL-2000 from Sella and others, 2002. Other plate motion Models have been determined from geology and seismology (Nuvel1A) and hot spot tracks (HS3). UNAVCO Plate Motion Calculator Also see NGS website for coordinate transformation tool.
Regional Plate Boundary Deformation Viscosity Observed GPS Velocity Field Finite Element Model L. Flesch and B. Holt
Deformation In the Plate Interior Horizontal and Vertical Motions from Glacial Isostatic Adjustment Stable North American Reference Frame (SNARF)
Permanent Stations Tectonic Signals Example of fairly linear motions (~2 to 3 mm/year) Basin and Range, Yellowstone U. of Utah, Caltech, Harvard SAO
P295 P526 P576 P278 P067 EarthQuake Transients Coseismic and Postseismic deformations for Parkfield 2004 earthquake.
Non-Tectonic Signals Hydrologic (non-tectonic time-dependent signals) Example from the Salt Lake Basin +- 3 cm vertical annual Signals from spring runoff (U. Utah)
GPS Seismology High rate Kinematic GPS…. 1 hz GPS “seismogram” compared with seismometer, Denali EQ. Bock, 2004. • Reasons to look at • High rate GPS EQs: • GPS directly measures displacement (not velocity or acceleration) • GPS does not clip • …but GPS is considerably less sensitive than a seismometer
EarthScope Instrumentation • 3.2 km borehole into the San Andreas Fault • 875 permanent GPS stations • Up to 174 borehole strainmeters • 5 laser strainmeters • 39 Permanent seismic stations • 400 transportable seismic stations occupying 2000 sites • 30 magneto-telluric systems • 100 campaign GPS stations • 2400 campaign seismic stations
Permanent GPS Stations Making Stable Monuments – Different options depending on cost, geology, permits
Campaign GPS EarthScope Campaign GPS 28 Portable Campaign GPS instruments and ancillary equipment purchased and ready for deployment. 72 Portable Campaign GPS instruments and ancillary equipment purchased in FY06. Rio Grande Rift 5-year proposal funded through ES science 30 instrument Cascadia ETS Campaign for summer/fall 2005 (underway)
Campaign GPS Come see the new EarthScope/PBO GPS gear in the poster session! Topcon GB-1000 Tech 2000 mast
PBO Campaign – ETS Cascadia Cascadia Episodic Tremor and Slip Event Principal Investigator (PI): Ken Creager, Dan Johnson & Rick Bennett UNAVCO staff: Freddy Blume (PBO Project Manager) & Nicole Feldl Photo Location: Clallam Bay, Washington 30 Portable GPS Systems deployed
EarthScope Operational Status Shown are PBO GPS Stations with data available from the UNAVCO Archive
GPS Data Flow and Access The user will get raw data, Solution time series and velocity vectors
Borehole Strainmeter Data Processing • BSM Data Analyst: Kathleen Hodgkinson • First Level 0 data: June 2005 • Pre-processing: • Decimate, linearize, remove tidal & borehole effects • Determine data edits using initial corrections • Processing: • Edit raw data for outliers, offsets, etc. • Remove borehole trends • Generate tidal correction • Compute areal and shear strain • Convert to XML • First Level 2 products: Sep 2005 • Similar products from LSM (SIO)
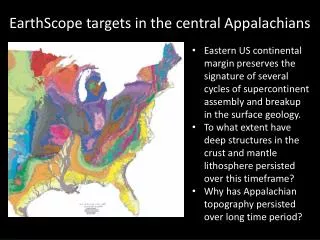
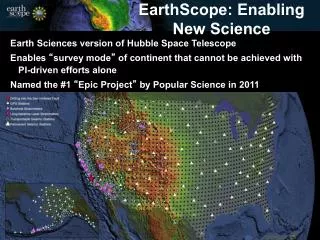
GEO-EARTHSCOPE EarthScope Imagery and Geochronology “The EarthScope program invites proposals that include the acquisition of aerial and satellite imagery and geochronology that will examine the strain field beyond the decade time scales available from the PBO geodetic instrumentation. A goal of EarthScope is the improved understanding of the tectonic evolution of the North American continent. Identifying and understanding deformation rates in all tectonic regimes is critical to reaching that goal. Proposals should indicate how the imagery or geochronology will contribute to the success of EarthScope.” 2005 NSF EarthScope Announcement of Opportunity
GEO-EarthScope Possibilities 4. 1. 3. 2. • Airborne LiDAR image of the San Andreas fault. Courtesy of Ken Hudnut, USGS. • InSAR image of the Hector Mine earthquake. Courtesy of Howard Zebker, Stanford. • Ground Control using UNAVCO GPS receiver being deployed on the San Andreas fault to support an airborne LiDAR survey. Photo courtesy of Francine Coloma, NSIDC. • Geocronology associatedpaleoseismologystudy site on the San Andreas fault near Wrightwood, CA. • AMS Lawrence Livermore Accelerator Mass Spectrometer 5. Contact: Dr. David Phillips, UNAVCO/PBO Geo-EarthScope Project Manager
UNAVCO Support UNAVCO Support Requests • Permanent Stations • Semi-permanent Stations • Campaign Surveys • GeoEarthScope Come to UNAVCO for help with your project from proposal planning to project implementation!
For more information… http://pbo.unavco.org www.earthscope.org