Download
1 / 15
150 likes | 166 Vues
Analysis and Implementation of Improved Boundaries in a Pre-operational Model for the Tagus Estuary to Enhance Predictions of Water Levels, Temperature, and Salinity. Assessment of Impact on Hydrodynamics and SST. Conclusions and Recommendations for Model Refinement.

E N D
Test of improved boundaries configuration for the Tagus Estuary Pre-operational Model (OM) Ângela Canas Maretec SANEST
What was known: • Studies show needed improvement of boundary conditions: large, surface, rivers, bathymetry (e.g. R. Fernandes, 2005) • Version 4 of MOHID allows advanced advection Continental Portuguese Coast Assess effect in 3D Level 2 results of all possible improvements of boundaries and advection now possible Level 1 Level 2 Sorraia hourly flow New bathymetry Relaxation to Levitus monthly profile climatology (T, S) MM5 HDF5 forcing Common in literature Advection TVD - Superbee Objective
To support internal tide ConvertToHDF5 action Patch HDF5 Files Methodology Background: Level 1: S. Vicente Leixões, 2D, resolution 2 km, barotrophic, upwind, BIHARMONIC_COEF : 1e8, time serie MM5 forcing, tide, t = 60s Level 2: 3D (11 layers), resolution 0.32km, baroclinic, BAROCLINIC_METHOD : 1, upwind, 36 psu relax. b.c., hydro Flather radiation b.c., time serie MM5 forcing, t = 15s, Tagus – Sorraia – Trancão river flows, GOTM Simulation 1 (S1) Current configuration but Version 4 Changes: Level 1: Portuguese Coast, resolution 24km, TVD - Superbee, BIHARMONIC_COEF : 1e9, HDF5 MM5 forcing (best resolution) Level 2: 3D (33 layers), BAROCLINIC_METHOD : 3, BAROCLINIC_POLIDEGREE : 1, TVD - Superbee, relax. to 1 T/S Levitus profile in all boundary, HDF5 MM5 forcing (best resolution) Simulation 2 (S2) Improved configuration (Version 4)
After 08/02/2005, 6h: b.c. for T/S = null gradient for dephts < 100m bigger concurrence with MODIS SST S1 15/01/2005, 0h 01/03/2005, 0h S2 • Assessment (01/02/2005 01/03/2005): • Predicted tide gauge water level (TidePrev) • SST (MODIS) • CTD (SANEST) Methodology • Initialization: • Slowstart, wind smooth period (1 day) • Level 2: water level = 2.08m, baroclinic ramp 1 inertial period (S2) • Temperature: constant 16ºC (S1), Levitus (S2) • Salinity: estuary boxes, sea constant 36 psu (S1) or Levitus (S2) • Density: constant 1026.73 g/m3 (S1), variable in depth for pressure (S2)
S2 S1 Velocity modulus (m/s) Velocity modulus (m/s) Results: hydrodynamic Surface values Maximum velocity points in Nazare canyon according with known internal tide (H. Coelho, C. Garcia) • Internal tide: • Associated with vertical oscilations of isotherms due to interaction between tide and continental shelf slope • Not visible in the water level (change only a few cm)
Results: hydrodynamic better bathymetry higher resolution • Greater improvement inside estuary • Still, better results outside estuary
Results: hydrodynamic • Significant phase differences do not occur • Mean level generally smaller in model Water level in channel areas still poorly represented Improve grid resolution Study of the effect of pressure in water level (to be released) evidences que existence of a systematic error in mean level used for tide forcing (2.08m) causes degradation of RMSE
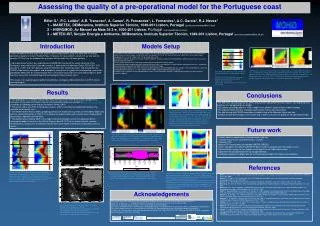
Results: SST • Improvements: • more realistic spatial variability • acceptable results in the Outfall in upwelling events
Results: SST systematic cooling • Remaining problems: • off-coast poor results • systematic general cooling • null gradient b. c. not adequate • boundaries too close to interest area • excessive internal tide causes too much mixture (low sensitivity to meteo)
Results: vertical stratification, temperature and salinity Overestimation of T and underestimation of S greatly reduced Measurement date: 01/02/05 Guia Outfall near location G08 Depths: 2.55m, 7.5m, 15m and 27.5m
Results: vertical stratification, temperature and salinity Stratification still poorly captured Error in salinity and temperature non concurrent ? Poor vertical discretization CTD and field data should be found and analysed for off-coast (Coriolis)and inside estuary
Results: kinetic and potential energy Higher initial energy effect of internal tide Different tide print on potential energy ? Decrease of potential energy water too hot induces sinking Still observed in Simulation 2
Conclusions • New configuration provides improved results for: • Water level: especially inside the Tagus estuary effect of new bathymetry; • Temperature/salinity: especially in the Guia Outfall area effect of improved stratification; • Unsolved problems: • Water level in channels near river locations; • SST away from coast.
Conclusions • Detected incorrections: • Time serie for atmospheric forcing of current configuration not represent surface values (average of first MM5 layer): Explains in part disparities found by R. Fernandes (2005)
Conclusions • Detected incorrections: • Tide component files for Montijo, Seixal and Alcochete with incorrect time reference (less 1h) Tide appears first in model