Download
1 / 36
360 likes | 363 Vues
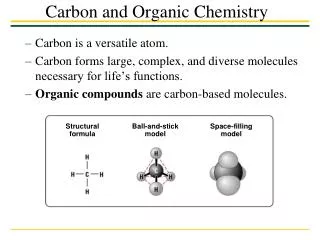
Gain insights into the mechanisms driving the flux of particulate organic carbon (POC) in the ocean. Understand the importance of sinking particulate matter in removing carbon from the ocean and its impact on CO2 concentrations over time. Explore the role of ballast minerals and aggregation in predicting carbon export and sinking velocities of organic carbon.

E N D
PERSPECTIVES ON MECHANISMS DRIVING PARTCULATE ORGANIC CARBON (POC) FLUX: INSIGHTS FROM MEDFLUX Ocean Carbon and Climate Change Woods Hole, MA August 1-4, 2005 CNRS
Ocean Carbon Cycle Pool units: 1015 gC Flux units: 1015 gC/y Intermediate and deep ocean 38,100 (from Doney, S.C. and D. Schimel 2002. Global change - The future and the greenhouse effect. Encyc. Life Sci., Macmillan Publ. Ltd., www.els.net)
Why care about sinking particulate matter? It is one of the few processes that removes C from the ocean for long enough to ameliorate the increasing CO2 concentration over time. Bermuda Atlantic Time-Series Station (from USJGOFS Image Gallery)
A narrative of why we wanted to know how fast particles sink, and what we can do now that we know
Early studies showed that organic compound fluxes “exponentially” decrease with depth suggesting different reactivity for different organic compounds and classes (Wakeham, S. G. and C. Lee. 1993. Production, transport, and alteration of particulate organic matter in the marine water column. In: Organic Geochemistry (M. Engel and S. Macko, eds.), Plenum Press, pp. 145‑169)
To calculate an organic matter degradation rate, we needed the particle sinking rate. • First direct evidence that some particles sank rapidly in the open ocean was seen in sediment trap studies by Honjo, Deuser and others in the 1970s. • The difference in peak fluxes was used to calculate an average sinking rate of 150-200 m/d.
Sargasso Sea Fluxes Phytoplankton Biomass (monthly average) Carbonate Flux Organic C Flux CZCS pigments (mg C/m2d) (mg C/m2d) (mg/m3) Organic Carbon Flux (bimonthly average) Inorganic Carbon Flux (bimonthly average) (Deuser, W.G., F. E. Müller-Karger, R. H. Evans, O. B. Brown, W.E. Esaias and G. C. Feldman. 1990. Surface-ocean color and deep-ocean carbon flux: How close a connection? Deep-Sea Res. II 37: 1331-1343)
BUT, in the lab, plankton cells, fecal pellets and detritus have different sinking rates. • Stokes Law suggests that sinking rate is mainly dependent on size, suggesting that particles that aggregate and become larger, sink faster.
In late 80s, the Open Ocean Composite Curve (“Martin curve”) was published. F=1.53(z/100)-0.858 (Martin, J.H., G.A. Knauer, D.M. Karl, W.W. Broenkow. 1987. VERTEX: carbon cycling in the northeast Pacific. Deep-Sea Res. 34: 267-285)
But, why would the ocean follow a power law? What are the mechanisms involved? Prediction requires knowledge of mechanisms and how those mechanisms respond to perturbations.
Biological Carbon Pump CO2 N2 fixation of C, N by phytoplankton respiration grazing excretion physical mixing of DOC egestion aggregate formation Lateral advection break up Base of euphotic zone active vertical migration passive sinking of POC, PIC consumption, repackaging decomposition respiration (zooplankton) (bacteria) excretion Seabed (from OCTET Report, 2000)
Next, we observed “uncharacterized” organic matter in sediment trap material. Long seen in sediments, we were surprised that so much uncharacterized material was formed in the upper ocean. Why?
POC flux and major biochemical abundances in the Equatorial Pacific 2 Percent of Organic Carbon POC Flux, mg/m d 0.01 100 20 40 60 80 0 1.0 100 Plankton Amino Acid 105 m Trap 1000 m Trap Uncharacterized Lipid >3500 m Trap Sediment Carbohydrate Pigment (Wakeham, S. G. and C. Lee. 1993. Production, transport, and alteration of particulate organic matter in the marine water column. In: M.H. Engel and S. A. Macko (eds) Organic Geochemistry, pp. 145-169. Plenum Press)
Looking at the JGOFS data, we observed that OC fluxes and concentrations behaved differently. Organic carbon fluxes decrease with depth to varying degrees at different locations. The percent of total mass made up by organic carbon reaches a constant value at depth, ~5%. (Armstrong R. A., C. Lee, J.I. Hedges, S. Honjo and S.G.Wakeham. 2002. A new, mechanistic model for organic carbon fluxes in the ocean based on the quantitative association of POC with ballast minerals. Deep-Sea Res. II, 49: 219-236)
We hypothesized that ballast minerals on sinking particles physically protect a fraction of their associated organic matter, and that the ratio of organic carbon to ballast is key to predicting variability in export fluxes and sinking velocities of organic carbon. Labile Total Flux Ballast associated (Armstrong et al. 2002)
Obvious questions arose: Are ballast minerals a key to predicting carbon export? What role does aggregation play in sinking? Are ballast and aggregation equally important throughout the water column? Do minerals physically protect a fraction of their associated total organic matter? Do all minerals behave the same way?
U.S. Collaborators:Robert Armstrong, SBUKirk Cochran, SBUCindy Lee, SBUMichael Peterson, Seattle Stuart Wakeham, Savannah Students/Postdocs: Lynn Abramson, SBU Aaron Beck, SBU Anja Engel, SBU->AWI Zhanfei Liu, SBUGillian Stewart, SBUJennifer Szlosek, SBUJianhong Xue, SBU European Collaborators: Scott Fowler, Monaco->SBU Madeleine Goutx, Marseille Giselher Gust, Hamburg Pere Masqué, UAB Juan Carlos Miquel, Monaco Olivier Rageneau, Brest Richard Sempéré, Marseille Christian Tamburini, Marseille Students/Postdocs: Joan Fabres, UB->SBU Beat Gasser, Monaco Romain Pete, Marseille Monique Ras, Marseille Catherine Guigue, Marseille Marc Garel, Marseille Alessia Rodriguez, Monaco Tarik Toubal, Monaco Brivaela Moriseau, Brest->SBU Elisabet Verdeny, Barcelona See http://www.msrc.sunysb.edu/MedFlux/ for more information.
MONACO MedFlux Sampling site Slide 15 French JGOFS site, 15 years data, Near-shore but deep water (2300 m), Free of major coastal influence, Seasonality in biological structure and mineral ballast types, Saharan dust inputs, Seasonality of POM fluxes, Close to Monaco’s IAEA lab
Michael Peterson IRSC sediment traps can be configured to collect in a time-series or settling-velocity mode. Slide 4
TIME-SERIES MODE In 2003, mass flux peaked after the spring bloom and rapidly decreased with time at both 200 and 800 m. We measured the percent organic carbon in the trap samples. The %OC is higher when mass fluxes are lower. MedFlux Time-series Mooring: March-May 2003 (Peterson, M.L., S.G. Wakeham, C. Lee, J.C. Miquel and M.A. Askea. 2005. Novel techniques for collection of sinking particles in the ocean and determining their settling rates. Limnol. Oceanogr. Methods, accepted.)
SETTLING-VELOCITY MODE At 200 m, highest particle flux occurs at rates between 200-500 m/d. Percent organic carbon is higher at lower settling velocities. MedFlux Settling Velocity Trap: March-May 2003 (Peterson et al. 2005) MedFlux 2003
MedFlux 2003 Positive correlation Negative correlation Parameters are: %ASP, GLU, HIS, SER, ARG, GLY, BALA, ALA, TYR, GABA, MET, VAL, PHE, LEU, LYS, SER+GLY+THR, TAA, LIPIDS, Neuts/TFA, %MASS, Po, Th234, OC/MASS, IC/MASS, TN/MASS
The organic, inorganic and radioisotopic composition told us that the fastest settling particles fell just after the highest flux period. The fast-sinking particles made up 38% of the flux.
A little background: Organic Biomarkers as Diagenetic Indices (Sheridan C.C., C. Lee, S.G. Wakeham, and J.K.B. Bishop. 2002. Suspended particle organic composition and cycling in surface and midwaters of the equatorial Pacific Ocean. Deep-Sea Res. I 49: 1983-2008)
March-May 2003 SV 200 m amino acids and pigments showed increase in degraded material with decreasing settling velocity Bacterially degraded Fresh phytoplankton & fecal pellets
We also tried another technique to measure settling rate - Elutriation
Most material falls at rates greater than 230 m/d. Th activity was higher at lower settling velocities (but Th/POC did not vary much). Total Mass in Elutriator Fractions (g) Mass 234Th Activity 234Th Activity (dpm/g) MedFlux 2003 Cochran et al. in prep
Principal components analysis of amino acids in elutriated NetTrap samples Faster sinking particles (NT 1-3) Tarik Toubal, Monaco Fresher material Slower sinking particles (NT 4 & 5) Bacterially degraded MedFlux 2003 Goutx et al. in prep
We now know that the composition of material settling at different rates has different composition and source. Let’s get back to settling velocity…
200m in March-May and May-June 2003 To compare different locations and times, we normalized for the different size SV bins: Mass flux density has the same relationship to mass flux that probability has to probability density: the area under the bar is mass flux, while the height of the bar is mass flux density. The MFD-SV pattern was the same in March-May and May-June despite the large difference in mass flux.
Now let’s compare depths. In 2003, we had only 200m data. In 2005, we had mass flux density as a function of settling velocity at 200, 400 and 1800m during March-April, the spring bloom period. At this site at this time, the spectra are almost identical! 2003 2005 2005
What does this mean? Paul Hill (1998) was probably right! Slowly sinking particles collide with other particles to form larger aggregates, but when they get too large and start sinking too quickly, they fall apart because of the high shear. Basically, particle size and sinking velocity adjust to changes in particle density, always yielding the same sinking velocity spectrum. Because of this constancy, remineralization time is directly proportional to depth in remineralization profiles, enabling calculation of absolute rates.
How can we test this? We are proposing to measure the extent of equilibration between fast and slow sinking particles. The relationship of particle compositions of fast- vs. slow-sinking particles should be determined by the ratio of remineralization rate R to exchange rate E. In the case of little or no exchange between fast- and slow-sinking particle pools (E<<R), we expect the difference in DI and POC/Th between slow and fast pools to increase with depth.
non- calcareous aggregates calcareous aggregates E. huxleyi cell aggregates that formed during decomposition experiments. The scale (1 cm) is the same in both photos. Visible aggregates in the calcified culture formed earlier, were smaller but more abundant, and made up more of the particulate volume than in the naked cell case.(Engel et al. in prep)
Further Thoughts: If biominerals enhance plankton aggregation as well as prevent their decomposition, then mineralized plankton would be preferentially exported from the euphotic zone, and aggregation could be considered as the first step in the association between carbon and minerals in sinking particles. Dust would not be as effective a ballast. Below the euphotic zone, there is an equilibrium settling velocity spectrum that depends on size and density. The extent of exchange between fast and slow sinking particles is not yet known but we now have the tools to find out. The current increasing acidification of the ocean will result in dissolution of forams and coccolithophorids. Since many think that CaCO3 is the most important ballast for transport of OC, there will be less flux, less organic C export, and thus less CO2 permanently removed from the surface ocean.
The MedFlux Monte Carlo Model….. Courtesy Beat Gasser & Stuart Wakeham