Download
1 / 83
830 likes | 930 Vues
This PowerPoint presentation aims to assist science teachers in discussing low-emission energy resources, greenhouse gas mitigation methods, and the impact of fossil fuels on climate change. It emphasizes reducing CO2 emissions and adopting renewable energy sources. The content covers emissions from power generation, transportation, industry, agriculture, and residential/commercial sectors. It provides statistics on fossil fuel usage, energy units (joule, watt), and emphasizes the importance of transitioning to renewables. The presentation also discusses global energy consumption trends, wind and solar power potentials, and introduces solutions like wind power, solar energy, and technologies for achieving zero emissions. It addresses challenges such as political barriers, vested interests, and societal apathy towards sustainable energy. The slides encourage educators to adapt and combine the content for classroom discussions to raise awareness about climate change and the urgent need for sustainable practices.

E N D
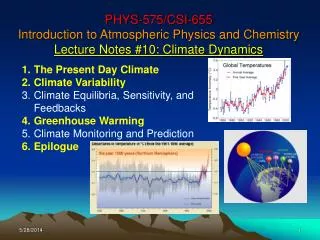
NOTES: ‘Science Teachers for Climate Awareness’ • This ppt is designed for use of science teachers in talking about low emission energy resources and other greenhouse mitigation methods. • We suggest adapting this ppt to your own liking or combining with others. • For suggestions for improvements please contact KB at • PLEASE NOTE: This will never be a ‘complete’ presentation but is provided for ideas and feedback. It will be updated as time allows! • Be sure to look at the ‘notes’ pages below for suggestions for how to use and more detail. • This AIP web version 20 Feb 2011 • THIS IS PART 1 OF THIS PRESENTATION – THIS PART CONTAINS THE MORE IMPORTANT SECTIONS AND COULD BE USED ALONE.
Climate Change: We CAN reduce the CO2 and other greenhouse gases in our atmosphere to safer levels And now for the GOOD news!
What are the problems? • Emission of greenhouse gases from • Generation of electric power • Transport • Industry • Home and Commerce • Land use and Agricultural emissions • Greenhouse gases come mostly from using fossil fuels, but also from sources such as agriculture
What are the problems? • We have to reduce our dependency on fossil fuels: Total fossil: (in 2006) 410,000 PJ Total non fossil: 70,000 PJ ie. 15 % X X
What are the problems? Renewables ~6% • Australia is even worse! • ABARE: past use and future projections • We use about 6,000 of those 410,000 PJ ie. 1½ % We are here! Oil Gas Brown Coal Black coal (But our population is ~ 0.3%)
Energy units • A quick word on energy units: • The basic unit of energy is the joule (J) • It is about the energy of a falling apple • 1 Megajoule (MJ) is 106 J • 1 Gigajoule (GJ) is 109 J • 1 Terajoule (TJ) is 1012 J • 1 Petajoule (PJ) is 1015 J My Goodness That’s Plenty
‘Energy’ & ‘Power’ • ENERGY is a total quantity • Examples: • Fuel tank of a car – approx 2 GJ • Coal in Latrobe Valley – approx 300,000 PJ • POWER is the rate of energy use • 1 watt = 1 joule per second (W = J/s) • Examples: • Light bulb: 15 watts = 15 joules every second • Car: 100 kW = 100 kJ/sec (or 2 GJ in 5½ hours) *? • Power station 2000 MW = 2000 MJ every second = 173,000 GJ each day = 63 PJ per year
Energy units • Electrical energy is measured in kilowatt.hours (that is, a 1000 W appliance for 1 hour) • 1 kWh = 3.6 MJ (Megajoule) • Hazelwood produces about 1600 Megawatts which means 1600 MWh each hour or ~ 6,000,000 MJ which is 0.006 PJ each hour or 50 PJ each year
And 17,000,000 tonnes of CO2 (30 tonnes every minute) (= CO2 from 200 car petrol tanks)
Energy units • Fossil fuels are sometimes measured in ‘Quads’, a quadrillion BTU (British Thermal Units) • 1 Quad = 1055 PJ (≈ 1000 PJ) • A Quad is huge! • Total world fossil fuel use per year is about 400 Quad • We will try to use PJ as far as possible Quads
What are the problems? • Most electricity is produced from fossil fuels: This must NOT be allowed to happen! Fossil fuels PS: 20 trillion kWh = 72,000 PJ (per year)
What are the problems? • Again – we are worse! X! Mostly hydro! 94% Wind, Solar and Biomass currently about 1%
November 2009 That’s ALL the WORLD’s energy
The ‘WWS’ solution: Wind Water Solar November 2009 NOT including: CCS, Nuclear, Other ‘exotic’ sources
HUGE RESOURCES AVAILABLE AVAILABLE TECHNOLOGY COST EFFECTIVE POLITICS BIGGEST OBSTACLE
Tidal Geothermal Hydro 9% Wind Wave 51% NEEDED 11.5 TW Solar Roof PV Concentrated PV Power 40% READILY AVAILABLE 580 TW 85%
NB: Australian coal is cheaper than US power. The REAL problem! Vested interests and confusion/apathy among ‘ordinary people’ – leading to lack of political will.
Australian Solutions! • The big picture: • Solar and Wind • supplemented by • Hydro • Geothermal • Ocean (tidal and wave) • and perhaps ? • Gas • Nuclear (?) • Coal with CCS (??)
Australian Solutions - solar! • The yellow square is about 125 km square • Ample for ALL of Australia’s energy. (At only 10% collection efficiency) 35 PJ per day That is about 250 Hazelwoods!
Australian Solutions - wind! • “A network of land-based 2.5 MW turbines … operating at as little as 20% of their rated capacity could supply over 40 times current worldwide consumption of electricity” Global potential for wind-generated electricity Lua, McElroy, Kiviluomac, Harvard & Finland, April09 Australia’s 86 PWh = 310,000 PJ (per year) Current total energy use is 6,000 PJ Annual Global potential for wind-generated electricity: Xi Lua, Michael B. McElroya, and Juha Kiviluomac
The Solutions! – World wind power Australia 2008 approx 1,500 MW (14th place) NB: 2.862 means 2,862
Australian Solutions! • Introducing: Beyond Zero Emissions (BZE) Five phase study to achieve zero emissions by 2020: • Stationary Energy* (mostly electricity generation) • Transport • Industrial processes and export • Buildings • Land Use (including agriculture & forestry) * Stationary energy report available now at www.beyondzeroemissions.org (free) or buy today!
Zero Carbon Australia 2020 A plan for repowering Australia with 100% renewable energy in ten years
Key Questions: Who are Beyond Zero Emissions? Zero Carbon Australia Plan What are we calling for and why? 100% renewable energy by 2020 How can we get there? Wind and Baseload Solar Thermal Can it be done? Yes. Fully modelled and costed, using existing commercial technologies
TheCAN'T DOcampaign Oil and Gas Generators Coal exporters The CAN'T DO MANTRA “Renewable energy cant supply baseload power” “Renewable energy is too expensive” “Renewable energy will wreck the economy” “Renewable energy will cost jobs”
"Australia has one of the world's best solar energy resource, ... The Zero Carbon Australia Plan is based on up-to-date and sound information and provides quality insights on how a country well-endowed in renewable resources can transition to a solar and wind economy.” Cédric Philibert Renewable Energy Division International Energy Agency "This report will help shift the climate debate to focus on energy; security; affordability; export and of course opportunity” Professor Robin Batterham, President, Australian Academy of Technological Sciences and Engineering, formerly Chief Scientist of Australia “We have the resources. We need the will.” Dr. Peter Doherty, Nobel Laureate, School of Medicine, University of Melbourne
TheCAN DO Campaign • Accepts current climate science evidence on what has to be done & by when • Uses only existing commercially available technology. We have all the tools NOW • Meets Australia’s total energy demand • with 100% Renewable Energy by 2020
Why? www.ncdc.noaa.gov/bams-state-of-the-climate/ July 2010
Why? www.ncdc.noaa.gov/bams-state-of-the-climate/
Why? www.ncdc.noaa.gov/bams-state-of-the-climate/
Why? www.ncdc.noaa.gov/bams-state-of-the-climate/ July 2010
Why? www.science.org.au
FIVE REPORTS: Stationary energy Transport Buildings Agriculture Industry
Carbon Budget 2010-2050 Why ten years? “Limiting CO2 emissions to 1 trillion tonnes* by 2050 gives us a 75% chance of keeping global warming below 2oC” * 2000 - 2050 Meinshausen, et al. (2009): Greenhouse-gas emission targets for limiting global warming to 2oC. Nature 458, 30 April 2009 SEE ALSO www.PRIMAP.org
Why ten years? Carbon Budget 2010-2050
Why ten years? Mark Jacobson, Mark Delucchi: Shifting the world to 100% clean, renewable energy by 2030 The cost of generating and transmitting power would be less than the projected cost per kilowatt-hour for fossil-fuel and nuclear power. • 4 million large wind turbines, • 90,000 solar plants, • numerous geothermal, tidal and rooftop PV installations worldwide. SCIENTIFIC AMERICAN November 2009
Why ten years? Al Gore calls for 100% clean electricity and independence from foreign oil within ten years “a political promise to do something 40 years from now is universally ignored because everyone knows that it's meaningless. Ten years is about the maximum time that we as a nation can hold a steady aim and hit our target.”
Why ten years? Thomas Friedman: Three reasons for going renewable - End dependence on, and financing of, the “dictators and terrorists in the Middle East” ‘Peak oil’ will mean higher prices, yet more political tension. If we divide the total of the world’s oil reserves by the rate at which WE are using them we get about 12 years (7 for USA use) Oh – and to save us from a climate catastrophe!
Traditional Power Generation Generating electrical energy
Generating electrical energy 67% Fossil 92%