Download
1 / 30
300 likes | 461 Vues
WIC Inservice. Implementation of WHO growth charts and related risks for infants and children. Background. Growth charts are a key tool used to interpret growth measurements. Activity. Discuss together: How do you use growth charts? When do you show growth charts to parents?

E N D
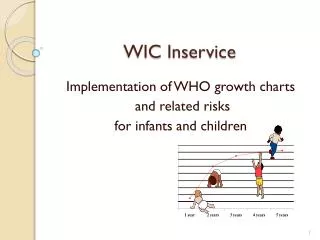
WIC Inservice Implementation of WHO growth charts and related risks for infants and children
Background • Growth charts are a key tool used to interpret growth measurements
Activity • Discuss together: • How do you use growth charts? • When do you show growth charts to parents? • How do you describe the graphs to parents?
History • From 1977 to 2000, National Center for Health Statistics (NCHS) charts used worldwide as a growth reference • Since 2000, Center for Disease Control (CDC) growth charts used as a growth reference for children age 0-20 years • April 2006, World Health Organization (WHO) released a new international growth standard for children age 0-5 years
Reference vs. Standard • Areferencedescribes how children have grown in a particular time and place, gives a point of comparison, does not make a value judgment • A standard describes how children shouldgrow, regardless of time or place, defines what is normal or optimal, allows for value judgments
CDC Growth Reference • Describes growth of children in the U.S. during the 1970s and 1980s • Based on data from national surveys and birth certificates • No special characteristics were required to be included in the data
WHO Growth Standard • Frequent data collection from birth to two years of age • Large number of observations completed internationally • Feeding requirements included: • Exclusive/predominant breastfeeding > 4 months • Complementary feeding by 6 months • Continued breastfeeding > 12 months
WHO Growth Standard • Optimal Nutrition • Breastfed with appropriate complementary feeding + • Optimal Environment • Clean, safe, smoke free + • Optimal Care • Access to immunizations and medical care = Optimal growth
WHO Growth Standard • Hypothesis: Children throughout the world will grow similarly if exposed to optimal circumstances • Data collected in: • United States • Brazil • Norway • India • Oman • Ghana
Growth patterns from birth to 24 months from the 6 WHO countries
Recommendations for the U.S. • American Academy of Pediatrics (AAP), National Institutes of Health (NIH) and CDC recommend national use of WHO charts from birth to 2 years and continued use of the CDC charts from 2 to 20 years • USDA accepts recommendation for WIC
Oregon Implementation • WHO charts added to TWIST in December 2011 • TWIST will continue to select and plot the appropriate charts for age: • WHO for children from birth to 2 years of age • CDC BMI charts for children from 2 to 5 years • CDC weight for length charts for children from 2 to 3 years if they cannot be measured standing up
Differences between Charts • WHO growth standards measured healthy children under optimal conditions so more extreme cutoffs are appropriate for children measured on WHO graphs • New cutoffs at the 2nd and 98th percentiles on WHO graphs • Continue to use 5th and 95th percentiles on CDC growth charts for older children
Differences between Charts • Fewer infants would be below 5th percentile on WHO weight-for-age charts • Fewer children will be identified as underweight or Failure to Thrive (FTT) especially from 6 to 23 months • More infants would be above 95th percentile on WHO weight-for-length • Formula-fed infants tend to gain weight more rapidly after 3 months and could be identified as overweight. • More infants would be below 5th percentile on WHO length-for- age charts
Comparison of WHO with CDC Weight-for-Age Percentiles for Boys CDC: Dotted lines WHO: Solid lines
Case Study • Compare the following growth charts for Sally • What are the differences between the CDC and WHO charts?
Three weight measurements for Sally plotted on the current CDC chart…
The same three weight measurements for Sally plotted on the new WHO charts…
WIC Risk Changes based onthe WHO Growth Charts • TWIST will continue to auto assign risks based on information entered on the medical data screen
103 Underweight (Infants and Children) • Underweight • Birth to < 24 months • New!≤ 2nd percentile weight-for-length • 2-5 years • New! ≤ 5th percentile Body Mass Index (BMI)-for-age • At Risk of Underweight • Birth to < 24 months • New! > 2nd percentile and ≤ 5th percentile weight-for-length • 2-5 years • New! >5th percentile and ≤ 10th percentile BMI-for-age
High Risk • With WHO charts, fewer children will be assigned the underweight risk. • When it is assigned, this indicates a significant issue with weight. • New! TWIST will assign a high risk level to children with this underweight risk. • These children will need to be referred to the WIC Nutritionist
113 Overweight (Children 2-5 Years of Age) • 2-5 years: ≥ 95th percentile BMI or weight-for-stature • Medium risk level • New!Only standing height measurements may be used to assign this risk • New!Risk title changed from “Monitor Weight”
114 At Risk of Overweight (Children 2- 5 years of age) • 2 - 5 years: • ≥85th and < 95th percentile BMI for age or weight-for-stature • New!Only standing height measurements may be used to assign this risk • Medium risk level
115 High Weight for Length (Infants and Children < 24 Months of Age) NEW RISK! • Birth to < 24 months: ≥98th percentile weight for length • Medium risk level
121 Short Stature (Infants and Children) • Short stature: • Birth to < 24 months: New! <2nd percentile length/age • 2-5 years: ≤ 5th percentile stature/ age • At risk of short stature: • Birth to < 24 months: New! > 2nd to ≤ 5th percentile length/ age • 2-5 years: >5th to ≤10th percentile stature/age
344 Thyroid Disorders NEW RISK (Not related to growth charts!) • Health care provider’s diagnosis of: • Hyperthyroidism • Hypothyroidism • Congenital hyperthyroidism or hypothyroidism • Postpartum thyroiditis • Medium risk level
Activity • Discuss together: • What terms do you use when talking to parents about their children’s weight?
Talking about weight • Use language that continues to avoid “obese” and “fat” labels • Consider use of supportive phrases such as monitor weight, watch weight gain, weight higher than average or weight above most children at that age etc.
Materials and Resources • Summary of Risk Changes document • Updated risk information sheets for the Nutrition Risk module • Updated Policy 675, Risk Criteria: Codes and Descriptions • World Health Organization website http://www.who.int/childgrowth/en/ • Centers for Disease Control and Prevention website http://www.cdc.gov/growthcharts/who_charts.htm • MMWR article September 10, 2010: • Use of WHO and CDC Growth charts for Children aged 0 -59 months • Pediatrics article; originally published online September 26, 2011: • Parental Perceptions of Weight Terminology That Providers Use With Youth
Questions? • Contact your nutrition consultant or Vernita Reyna RD • vernita.d.reyna@state.or.us