Comprehensive Analysis of Job Applicant Ratings Using Statistical Methods
This interview study analyzes job applicant ratings by different personnel officers using various statistical procedures.

Comprehensive Analysis of Job Applicant Ratings Using Statistical Methods
E N D
Presentation Transcript
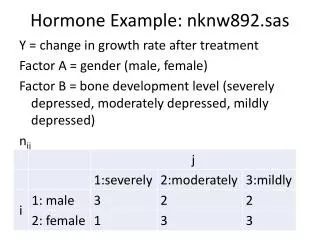
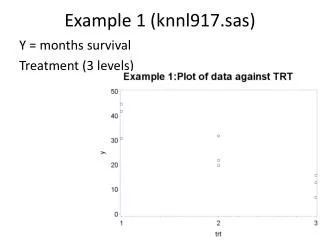
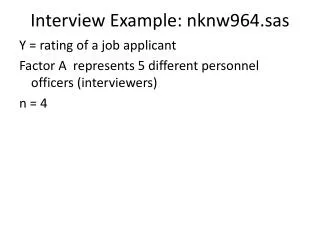
Interview Example: nknw964.sas Y = rating of a job applicant Factor A represents 5 different personnel officers (interviewers) n = 4
Interview Example: Input data interview; infile‘H:\My Documents\Stat 512\CH25TA01.DAT'; input rating officer; procprintdata=interview; run;
Interview Example: Scatterplot axis2label=(angle=90); symbol1v=circle i=nonec=black; procgplotdata=interview; plot rating*officer/vaxis=axis2; run; title1h=3'Scatterplot of rating vs. officer'; goptionshtext=2;
Interview Example: Means plot procmeansdata=interview; outputout=a2 mean=avrate; var rating; by officer; run; title1h=3'Plot of the means of rating vs. officer'; symbol1v=circle i=join c=black; procgplotdata=a2; plotavrate*officer/vaxis=axis2; run;
Interview Example: random ANOVA procglmdata=interview; class officer; model rating=officer; random officer; run;
Interview Example: Variances procvarcompdata=interview; class officer; model rating=officer; run;
Interview Example: ANOVA random (mixed) procmixeddata=interview cl; class officer; model rating=; random officer/vcorr; run;
Interview Example: ANOVA random (mixed) (cont) The Mixed Procedure
Efficiency Example: nknw976.sas Y = fuel efficiency in mpg Factor A = 4 drivers Factor B = 5 cars n = 4
Efficiency Example: Input goptionshtext=2; data efficiency; infile‘H:\My Documents\Stat 512\CH25PR15.DAT'; input mpg driver car; procprintdata=efficiency; run;
Efficiency Example: Scatterplot data efficiency; set efficiency; dc = driver*10 + car; title1h=3'Scatterplot'; axis2label=(angle=90); symbol1v=circle i=nonec=blue; procgplotdata=efficiency; plot mpg*dc/vaxis=axis2; run;
Efficiency Example: Interaction Plot procmeansdata=efficiency; outputout=effoutmean=avmpg; var mpg; by driver car; title1h=3'Interaction Plot'; symbol1v='A'i=join c=black h=1.5; symbol2v='B'i=join c=red h=1.5; symbol3v='C'i=join c=green h=1.5; symbol4v='D'i=join c=blue h=1.5; symbol5v='E'i=join c=orange h=1.5; procgplotdata=effout; plotavmpg*driver=car/vaxis=axis2; run;
Efficiency Example: ANOVA procglmdata=efficiency; class driver car; model mpg=driver car driver*car; random driver car driver*car/test; run;
Efficiency Example: ANOVA (cont) Tests of Hypotheses for Random Model Analysis of Variance Dependent Variable: mpg
Efficiency Example: variances procvarcompdata=efficiency; class driver car; model mpg=driver car driver*car; run;
Efficiency Example: ANOVA procmixeddata=efficiency cl; class car driver; model mpg=; random car driver car*driver/vcorr; run;
Service Example: 25.16 (nknw1005.sas) Y = service time for disk drives A = make of drive (3) fixed B = technician performing the service (3) random n = 5
Service Example: input data service; infile'H:\My Documents\Stat 512\CH19PR16.DAT'; input time tech make k; mt = make*10+tech; procprintdata=service; run; title1'Proc glm with tech, make*tech random'; procglmdata=service; class make tech; model time = make tech make*tech; random tech make*tech/test; run;
Service Example: /test Tests of Hypotheses for Mixed Model Analysis of Variance Dependent Variable: time