Hormone Interaction Analysis for Growth and Bone Development
490 likes | 585 Vues
Explore the relationship between hormone levels, growth rates, gender, and bone development stages through ANOVA, contrast analysis, and interaction plots.

Hormone Interaction Analysis for Growth and Bone Development
E N D
Presentation Transcript
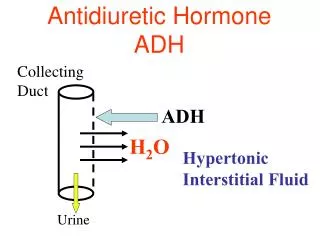
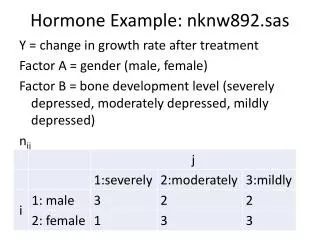
Hormone Example: nknw892.sas Y = change in growth rate after treatment Factor A = gender (male, female) Factor B = bone development level (severely depressed, moderately depressed, mildly depressed) nij
Hormone Example: Input data hormone; infile‘H:\My Documents\Stat 512\CH23TA01.DAT'; input growth gender bone; procprintdata=hormone; run;
Hormone Example: Scatterplot data hormone; set hormone; if (gender eq1)*(bone eq1) thengb='1_Msev '; if (gender eq1)*(bone eq2) thengb='2_Mmod '; if (gender eq1)*(bone eq3) thengb='3_Mmild'; if (gender eq2)*(bone eq1) thengb='4_Fsev '; if (gender eq2)*(bone eq2) thengb='5_Fmod '; if (gender eq2)*(bone eq3) thengb='6_Fmild'; run; title1h=3'Scatterplot Hormone Example'; axis1label=(h=2); axis2label=(h=2angle=90); symbol1v=circle i=nonec=blue; procgplotdata=hormone; plot growth*gb/haxis=axis1 vaxis=axis2; run;
Hormone Example: Means/Interaction procmeansdata=hormone; outputout=means mean=avgrowth; by gender bone; title1h=3'Plot of the means'; symbol1v='M'i=join c=black h=1.5; symbol2v='F'i=join c=purple h=1.5; procgplotdata=means; plotavgrowth*bone=gender/haxis=axis1 vaxis=axis2; run; symbol1v='S'i=join c=black h=1.5; symbol2v='M'i=join c=red h=1.5; symbol3v='L'i=join c=blue h=1.5; procgplotdata=means; plotavgrowth*gender=bone/haxis=axis1 vaxis=axis2; run;
Hormone Example: Means (cont) gender=1 bone=2 gender=1 bone=3 gender=2 bone=1 gender=2 bone=2 gender=2 bone=3
Hormone Example: ANOVA procglmdata=hormone; class gender bone; model growth=gender|bone/solution; means gender*bone;
Hormone Example: Contrast gender*bone contrast'gender*bone Type I and III' gender*bone 1 -10 -110, gender*bone 01 -10 -11;
Hormone Example: Contrast gender Type III contrast'gender Type III' gender 3 -3 gender*bone 111 -1 -1 -1; estimate'gender Type III' gender 3 -3 gender*bone 111 -1 -1 -1;
Hormone Example: Contrast gender Type I contrast'gender Type I' gender 7 -7 bone 2 -1 -1 gender*bone 322 -1 -3 -3; estimate'gender Type I' gender 7 -7 bone 2 -1 -1 gender*bone 322 -1 -3 -3;
Hormone Example: Contrast Bone III contrast'bone Type III' bone 2 -20 gender*bone 1 -101 -10, bone 02 -2 gender*bone 01 -101 -1;
Hormone Example: Contrast Bone I contrast'bone Type I' gender 7 -7 bone 20 -200 gender*bone 15 -805 -120, bone 05 -5 gender*bone 02 -203 -3;
Hormone Example: with pooling procglmdata=hormone; class gender bone; model growth=gender bone/solution; means gender bone/ tukeylines; run;
Exercise Example: nknw943.sas Y = exercise tolerance Factor A = gender (male, female) Factor B = percent body fat (low, high) Factor C = smoking history (light, heavy) n = 3
Exercise Example: input goptionshtext=2; dataexercise; infileH:\My Documents\Stat 512\CH24TA04.DAT'; input extol gender fat smoke; data exercise; set exercise; gfs = 100*gender + 10*fat + smoke; procprintdata=exercise; run;
Exercise Example: Scatterplot procsortdata=exercise; bygfs; run; title1h=3'Scatterplot'; axis2label=(h=2angle=90); symbol1v=circle i=nonec=blue; procgplotdata=exercise; plot extol*gfs/ haxis = 111112121122211212221222 vaxis=axis2; run;
Exercise Example: Interaction Plot procsortdata=exercise; by gender fat smoke; procmeansdata=exercise; outputout=exer2 mean=avextol; by gender fat smoke; data exer2; set exer2; fs = fat*10 + smoke; procprintdata=exer2; run;
Exercise Example: Interaction Plot (cont) title1h=3'Interaction Plot'; procsortdata=exer2; byfs; symbol1v='M'i=join c=blue height=1.5; symbol2v='F'i=join c=purple height=1.5; procgplotdata=exer2; plotavextol*fs=gender / haxis = 11122122 vaxis=axis2; run;
Exercise Example: ANOVA – full model procglmdata=exercise; class gender fat smoke; model extol=gender|fat|smoke / solution; means gender*fat*smoke; outputout=diag r = resid p = pred; run;
Exercise Example: Factor Effects Model – conceptual constraints
Exercise Example: interaction plot of smoke vs. body fat title1h=3'Mean of smoke/fat vs. smoke'; symbol1v=Li=join c=red; symbol2v=H i=join c=black; procgplotdata=BCdat; plotmuBC*smoke=fat /vaxis=axis2; run;
Exercise Example: Reduced model data exercise; set exercise; fs = 10*fat + smoke; run; procglmdata=exercise; class gender fs; model extol=gender fs; means gender fs/tukey; run;