Download
1 / 7
70 likes | 84 Vues
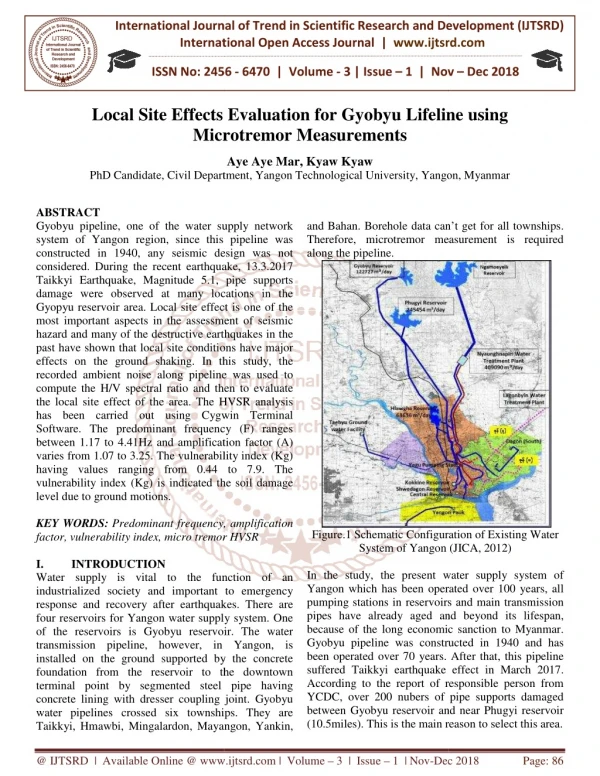
Gyobyu pipeline, one of the water supply network system of Yangon region, since this pipeline was constructed in 1940, any seismic design was not considered. During the recent earthquake, 13.3.2017 Taikkyi Earthquake, Magnitude 5.1, pipe supports damage were observed at many locations in the Gyopyu reservoir area. Local site effect is one of the most important aspects in the assessment of seismic hazard and many of the destructive earthquakes in the past have shown that local site conditions have major effects on the ground shaking. In this study, the recorded ambient noise along pipeline was used to compute the H V spectral ratio and then to evaluate the local site effect of the area. The HVSR analysis has been carried out using Cygwin Terminal Software. The predominant frequency F ranges between 1.17 to 4.41Hz and amplification factor A varies from 1.07 to 3.25. The vulnerability index Kg having values ranging from 0.44 to 7.9. The vulnerability index Kg is indicated the soil damage level due to ground motions. Aye Aye Mar | Kyaw Kyaw "Local Site Effects Evaluation for Gyobyu Lifeline using Microtremor Measurements" Published in International Journal of Trend in Scientific Research and Development (ijtsrd), ISSN: 2456-6470, Volume-3 | Issue-1 , December 2018, URL: https://www.ijtsrd.com/papers/ijtsrd18941.pdf Paper URL: http://www.ijtsrd.com/engineering/civil-engineering/18941/local-site-effects-evaluation-for-gyobyu-lifeline-using-microtremor-measurements/aye-aye-mar<br>

E N D
International Journal of Trend in International Open International Open Access Journal | www.ijtsrd.com International Journal of Trend in Scientific Research and Development (IJTSRD) Research and Development (IJTSRD) www.ijtsrd.com ISSN No: 2456 ISSN No: 2456 - 6470 | Volume - 3 | Issue – 1 | Nov Nov – Dec 2018 Local Site Effects Evaluation Microtremor Measurements Microtremor Measurements Local Site Effects Evaluation for Gyobyu Lifeline Lifeline using Aye Aye Mar, Kyaw Kyaw PhD Candidate, Civil Department Civil Department, Yangon Technological University, Yangon, Myanmar Yangon, Myanmar ABSTRACT Gyobyu pipeline, one of the water supply network system of Yangon region, since this pipeline was constructed in 1940, any seismic design was not considered. During the recent earthquake, 13.3.2017 Taikkyi Earthquake, Magnitude 5.1, pipe supports damage were observed at many locations in the Gyopyu reservoir area. Local site effect is one of the most important aspects in the assessment of seismic hazard and many of the destructive earthquakes in the past have shown that local site conditions have major effects on the ground shaking. In this study, the recorded ambient noise along pipeline was used to compute the H/V spectral ratio and then to evaluate the local site effect of the area. The HVSR analysis has been carried out using Cygwin Terminal Software. The predominant frequency (F) ranges between 1.17 to 4.41Hz and amplification factor (A) varies from 1.07 to 3.25. The vulnerability index (Kg) having values ranging from 0.44 to 7.9. The vulnerability index (Kg) is indicated the soil damage level due to ground motions. KEY WORDS:Predominant frequency, amplification factor, vulnerability index, micro tremor HVSR I. INTRODUCTION Water supply is vital to the function of an industrialized society and important to emergency response and recovery after earthquakes. There are four reservoirs for Yangon water supply system. One of the reservoirs is Gyobyu reservoir. The water transmission pipeline, however, in Yangon, is installed on the ground supported by the concrete foundation from the reservoir to the downtown terminal point by segmented steel pipe having concrete lining with dresser coupling joint. Gyobyu water pipelines crossed six townships. T Taikkyi, Hmawbi, Mingalardon, Mayangon, Yankin, Taikkyi, Hmawbi, Mingalardon, Mayangon, Yankin, Gyobyu pipeline, one of the water supply network system of Yangon region, since this pipeline was constructed in 1940, any seismic design was not considered. During the recent earthquake, 13.3.2017 and Bahan. Borehole data can’t get for all townships. Therefore, microtremor measurement is required and Bahan. Borehole data can Therefore, microtremor measurement is required along the pipeline. ude 5.1, pipe supports damage were observed at many locations in the Gyopyu reservoir area. Local site effect is one of the most important aspects in the assessment of seismic hazard and many of the destructive earthquakes in the site conditions have major effects on the ground shaking. In this study, the recorded ambient noise along pipeline was used to compute the H/V spectral ratio and then to evaluate the local site effect of the area. The HVSR analysis ing Cygwin Terminal Software. The predominant frequency (F) ranges between 1.17 to 4.41Hz and amplification factor (A) varies from 1.07 to 3.25. The vulnerability index (Kg) having values ranging from 0.44 to 7.9. The the soil damage Predominant frequency, amplification tremor HVSR Figure.1 Schematic Configuration of Existing Water System of Yangon (JICA of Yangon (JICA, 2012) 1 Schematic Configuration of Existing Water In the study, the present water supply system of Yangon which has been operated over 100 years, all pumping stations in reservoirs pipes have already aged and beyond its lifespan, because of the long economic sanction to Myanmar. Gyobyu pipeline was constructed in 1940 and has been operated over 70 years. After that, this pipeline suffered Taikkyi earthquake eff According to the report of responsible person from YCDC, over 200 nubers of pipe supports damaged between Gyobyu reservoir and near Phugyi reservoir (10.5miles). This is the main reason to select this area. (10.5miles). This is the main reason to select this area. In the study, the present water supply system of Yangon which has been operated over 100 years, all pumping stations in reservoirs and main transmission pipes have already aged and beyond its lifespan, because of the long economic sanction to Myanmar. Gyobyu pipeline was constructed in 1940 and has been operated over 70 years. After that, this pipeline suffered Taikkyi earthquake effect in March 2017. According to the report of responsible person from YCDC, over 200 nubers of pipe supports damaged between Gyobyu reservoir and near Phugyi reservoir s vital to the function of an industrialized society and important to emergency response and recovery after earthquakes. There are four reservoirs for Yangon water supply system. One of the reservoirs is Gyobyu reservoir. The water owever, in Yangon, is installed on the ground supported by the concrete foundation from the reservoir to the downtown terminal point by segmented steel pipe having concrete lining with dresser coupling joint. Gyobyu water pipelines crossed six townships. They are @ IJTSRD | Available Online @ www.ijtsrd.com www.ijtsrd.com | Volume – 3 | Issue – 1 | Nov-Dec Dec 2018 Page: 86
International Journal of Trend in Scientific Research and Development (IJTSRD) ISSN: 2456 International Journal of Trend in Scientific Research and Development (IJTSRD) ISSN: 2456 International Journal of Trend in Scientific Research and Development (IJTSRD) ISSN: 2456-6470 II. In the present study the micro tremor used to illustrate the local site effect for study area. The single-station method, where a three records form a single seismometer is processed to yield a spectrum of horizontal to vertical spectral ratio and these routine spectral techniques can easily be applied to estimate the dominant frequency of vibration of the sedimentary structure. These frequencies of vibration are closely related to the physical features of the site under study, i.e., layer thickness, densities and shear wave velocities. In addition, Microtremor also dominated by surface waves that can be used to determine the Rayleigh wave dispersion curve without the need for an artificial source. Microtremor analysis can be performed using HVSR method (Horizontal to Vertical Spectral Ratio). This method is one of the easiest and most inexpensive ways to understand the properties of the subsurface layer structure without causing disruption to the structure. HVSR method is a method that is used as an indicator of subsurface structure, which shows the relationship between the ratio of the spectrum of H/V with the ellipticity curve of Rayleigh waves. Comparison of the spectral of H / V is the ratio between the amplitude of Fourier spectral of horizontal and vertical components of microtremor [7]. Rayleigh Ellipticity is the ratio of the amplitude of spectral components of the horizontal to the vertical [8]. Ellipticity curve that is used in earthquake engineering fundamental frequency of earthquake locations and is very responsive to the location and depth of a layer. Microtremors can be classified in two major groups according to their frequency values: frequency values greater than 1 Hz (up to 20 Hz) known as period” which refer to shallow soil layers. The depths can change between 0 to 100 meters, performed with the effects of the local surface sources such as industry machines, wind, and traffic noises. Frequencies lower than 1 Hz called as microtremor” which refers to deeper soil layers like rigid rock formation and performed with natural forces such as ebb and tide, wind and underground seismic activities. Nakamura (1989) proposed a method inferring site amplification factors to incident seismic shear waves using microtremor HV ratio at single site. [9]. In this study, analyzing the site response using the HVSR method and calculated Kg values based on the microtremor data. Data was reprocessed using Cygwin Terminal software to estimate the Amplification estimate the Amplification METHODOLOGY Gyobyu reservoir is located in Taikkyi Township geological structure of Taikkyi area is underlain by alluvial deposits of Bago Yoma fan. Geographically, Taikkyi is situated in central Myanmar. Tectonically, it is located in the Ayeyarwady Delta basin in the west of Sagaing fault. Structurally, the town is located very close to a major strand of the Sagaing fault. [6] The objective of this paper is to investigate the soil conditions of the selected area where microtremor measurements are carried out along Gyobyu lifeline within Taikkyi area. The following figures show the pipe support cracks and their location within Taikkyi area. Each pipe independently moved vertically during earthquake. In recent earthquake, any leakage did not occur. The purpose of this study is to provide fundamental frequency, amplification factor and vulnerability index values for the study area. Township. The geological structure of Taikkyi area is underlain by alluvial deposits of Bago Yoma fan. Geographically, Taikkyi is situated in central Myanmar. Tectonically, it is located in the Ayeyarwady Delta basin in the west Structurally, the town is located very close to a major strand of the Sagaing fault. [6] The objective of this paper is to investigate the soil conditions of the selected area where microtremor measurements are carried out along Gyobyu lifeline kkyi area. The following figures show the pipe support cracks and their location within Taikkyi area. Each pipe independently moved vertically during earthquake. In recent earthquake, any leakage did not occur. The purpose of this study is to provide mental frequency, amplification factor and vulnerability index values for the study area. micro tremor technique was used to illustrate the local site effect for study area. station method, where a three-component records form a single seismometer is processed to yield a spectrum of horizontal to vertical spectral ratio and these routine spectral techniques can easily be applied to estimate the dominant frequency of vibration of the sedimentary structure. These frequencies of vibration are closely related to the ysical features of the site under study, i.e., layer thickness, densities and shear wave velocities. In addition, Microtremor also dominated by surface waves that can be used to determine the Rayleigh wave dispersion curve without the need for an l source. Microtremor analysis can be performed using HVSR method (Horizontal to Vertical Spectral Ratio). This method is one of the easiest and most inexpensive ways to understand the properties of the subsurface layer structure without to the structure. HVSR method is a method that is used as an indicator of subsurface structure, which shows the relationship between the ratio of the spectrum of H/V with the ellipticity curve of Rayleigh waves. Comparison of the spectral of H / ratio between the amplitude of Fourier spectral of horizontal and vertical components of microtremor [7]. Rayleigh Ellipticity is the ratio of the amplitude of spectral components of the horizontal to the vertical [8]. Ellipticity curve that is used in thquake engineering fundamental frequency of earthquake locations and is very responsive to the location and depth of a layer. Microtremors can be classified in two major groups according to their frequency values: frequency values ter than 1 Hz (up to 20 Hz) known as “short ” which refer to shallow soil layers. The depths can change between 0 to 100 meters, performed with the effects of the local surface sources such as industry machines, wind, and traffic noises. lower than 1 Hz called as “long period ” which refers to deeper soil layers like rigid rock formation and performed with natural forces such as ebb and tide, wind and underground seismic activities. Nakamura (1989) proposed a te amplification factors to incident seismic shear waves using microtremor HV ratio at single site. [9]. In this study, analyzing the site response using the HVSR method and calculated Kg values based on the microtremor data. Data was win Terminal software to Figure.2 Location of pipe supports damage within Taikkyi Figure.2 Location of pipe supports damage within is is to to determine determine the the Figure.3 Pipe displacement after Taikkyi earthquake Figure.3 Pipe displacement after Taikkyi earthquake factors (A) and Figure.4 some photos of pipe support damage photos of pipe support damage @ IJTSRD | Available Online @ www.ijtsrd.com www.ijtsrd.com | Volume – 3 | Issue – 1 | Nov-Dec Dec 2018 Page: 87
International Journal of Trend in Scientific Research and Development (IJTSRD) ISSN: 2456 International Journal of Trend in Scientific Research and Development (IJTSRD) ISSN: 2456 International Journal of Trend in Scientific Research and Development (IJTSRD) ISSN: 2456-6470 III. MICROTREMOR ALONG PIPELINE Microtremor measurements were performed along pipeline started in November 2017 to still now. The location of all sites is shown in Fig.7. The Global Positioning System (GPS) was used to determine the location and elevation of the measurement sites. The ambient noise vibrations were recorded using LS88 equipment. The sampling rate was 200 Hz with a recording duration of 30 minutes. The measurements were taken during the day, the distance between sites is about 500 meters and some sites is about 1 kilometer due to environmental constraints. As for the measurement along pipeline, over the one hundred and forty single station sites, which covered almost the whole area for pipeline, were measured by using GARMIN GPS 78 and LS8800 data logger shown in fig.5. ICROTREMOR MEASUREMENTS MEASUREMENTS fundamental frequency (F) for each observation point. Kg index was estimated for each site based on Nakamura (1996, 1997, 2000) technique. [10] A. Procedure for analysis This is the general procedure for calculation of H/V spectral ratio from record observation. fundamental frequency (F) for each observation point. index was estimated for each site based on ) technique. [10] Microtremor measurements were performed along ipeline started in November 2017 to still now. The location of all sites is shown in Fig.7. The Global Positioning System (GPS) was used to determine the location and elevation of the measurement sites. The ambient noise vibrations were recorded using LS8800 equipment. The sampling rate was 200 Hz with a recording duration of 30 minutes. The measurements were taken during the day, the distance between sites is about 500 meters and some sites is about 1 kilometer due to environmental constraints. As for the measurement along pipeline, over the one hundred and forty single station sites, which covered almost neral procedure for calculation of H/V were measured by using GARMIN GPS 78 and LS8800 data logger shown in Figure.5 Procedure of H/V spectral ratio Figure.5 Procedure of H/V spectral ratio After that, the vulnerability index values were calculated in the current study from the microtremor measurements. Seismic vulnerability index (K one of the simplest physical parameter that could be used to analyze the local geology condition. Seismic vulnerability index was derived from mathematical relationship between the resonance frequency and amplification factor of the ground natural vibration that obtained in horizontal vertical spectral ratio (HVSR) curve analysis. The vulnerability index values are calculated from using the equation (1) that is expressed by Nakamura (1997): Kg= A2 F where Kg is the vulnerability index, A is the amplification factor and F is the fundamental frequency. Kg value reflect local site effect and can be considered as an indicator which might be useful in selecting weak point of ground especially along pipeline areas. After that, the vulnerability index values were calculated in the current study from the microtremor measurements. Seismic vulnerability index (Kg) is one of the simplest physical parameter that could be ed to analyze the local geology condition. Seismic vulnerability index was derived from mathematical relationship between the resonance frequency and amplification factor of the ground natural vibration that obtained in horizontal vertical spectral ratio HVSR) curve analysis. The vulnerability index values are calculated from using the equation (1) that Figure.6 Observed microtremor in Figure.6 Observed microtremor instrument ) (1) is the vulnerability index, A is the amplification factor and F is the fundamental Kg value reflect local site effect and can be considered as an indicator which might be useful in selecting weak point of ground especially along Figure.7 Micro tremor measuring points along Gyobyu pipeline Gyobyu pipeline measuring points along @ IJTSRD | Available Online @ www.ijtsrd.com www.ijtsrd.com | Volume – 3 | Issue – 1 | Nov-Dec Dec 2018 Page: 88
International Journal of Trend in Scientific Research and Development (IJTSRD) ISSN: 2456 International Journal of Trend in Scientific Research and Development (IJTSRD) ISSN: 2456 International Journal of Trend in Scientific Research and Development (IJTSRD) ISSN: 2456-6470 IV. A.Distribution of soil natural frequency (F) and amplification factor (A) The results of microtremor HVRs for a single measurement along pipeline within Taikkyi area generally show the following figure that is one measurement. The fundamental amplification factor and vulnerability index values as shown in Table I. RESULTS AND DISCUSSION Distribution of soil natural frequency (F) and ISCUSSION s of microtremor HVRs for a single-station measurement along pipeline within Taikkyi area generally show the following figure that is one-point measurement. The fundamental amplification factor and vulnerability index values as frequencies, frequencies, Figure.8 Location of Microtremor measuring points within Taikkyi area Figure.8 Location of Microtremor measuring points Figure.10 Example of result of HVSR microtremor analysis And then, the measurement points were shown in an acceptable grid model, which was considered to accomplish good quality contour maps (ArcGIS software) that can display the distribution of the fundamental frequency, amplification factor and vulnerability. The figure. 11 shows the distribution of frequency (F) where the distribution of natural frequency is classified as equal interval, ranging between 1.17-4.41Hz. It could be noted that frequency (F) is associated with the depth of bedrock. The smaller of frequency (F) value, the greater of depth of bedrock. Figure.10 Example of result of HVSR microtremor analysis then, the measurement points were shown in an acceptable grid model, which was considered to accomplish good quality contour maps (ArcGIS software) that can display the distribution of the fundamental frequency, amplification factor and figure. 11 shows the distribution of frequency (F) where the distribution of natural frequency is classified as equal interval, ranging 4.41Hz. It could be noted that frequency (F) is associated with the depth of bedrock. The ency (F) value, the greater of depth of Figure.9 Micro tremor measurement beside pipeline measurement beside pipeline A.H/V technique and H/V inversion The H/V analysis is based on the theory introduced by Nogoshi and Igarashi [1] and further developed by Nakamura [2], who demonstrated that the spectral ratio between the horizontal and vertical components of a microtremor record is related to the fundamental resonant frequency at the stud application and interpretation of single point microtremor measurements are very straight forward and convenient, H/V method has become very popular in site-specific investigations for study area. In the case of the H/V inversion, the trade depths and velocities cannot be solved using only the H/V curve [3]. Therefore, it becomes necessary to retrieve some of these parameters (VS from other independent sources. In this work, reliable data from borehole drills have been used to define the parameter space and specifically, to constrain the number of layers and their corresponding thickness ranges. For all the generated models, the ellipticity of the fundamental mode Rayleigh wave is computed (forward problem) and compared with the empirical H/V curve through a misfit function [4], which indicates how far the generated models are from the observed H/V results. The H/V analysis is based on the theory first introduced by Nogoshi and Igarashi [1] and further developed by Nakamura [2], who demonstrated that the spectral ratio between the horizontal and vertical components of a microtremor record is related to the fundamental resonant frequency at the study site. the application and interpretation of single point microtremor measurements are very straight forward and convenient, H/V method has become very popular specific investigations for study area. In the case of the H/V inversion, the trade-off between depths and velocities cannot be solved using only the H/V curve [3]. Therefore, it becomes necessary to S or thickness) from other independent sources. In this work, reliable used to define the parameter space and specifically, to constrain the number of layers and their corresponding thickness ranges. For all the generated models, the ellipticity of the fundamental mode Rayleigh wave is computed with the empirical H/V curve through a misfit function [4], which indicates how far the generated models are from the Figure.11 the distribution of fundamental frequency values in the study area values in the study area distribution of fundamental frequency @ IJTSRD | Available Online @ www.ijtsrd.com www.ijtsrd.com | Volume – 3 | Issue – 1 | Nov-Dec Dec 2018 Page: 89
International Journal of Trend in Scientific Research and Development (IJTSRD) ISSN: 2456 International Journal of Trend in Scientific Research and Development (IJTSRD) ISSN: 2456 International Journal of Trend in Scientific Research and Development (IJTSRD) ISSN: 2456-6470 The figure 12 represents the amplification factor (A) or peak ratio HVSR spectrum in investigation ranging between 1.07 to 3.25. High amplification factor (A>3) is found in some area. Different value of A might be found in the same value of natural frequency. It can be noted that the variation of A value is not strongly affected by the soil depth. value is not strongly affected by the soil depth. The figure 12 represents the amplification factor (A) or peak ratio HVSR spectrum in investigation sites ranging between 1.07 to 3.25. High amplification factor (A>3) is found in some area. Different value of A might be found in the same value of natural frequency. It can be noted that the variation of A 12 13 14 15 16 17 18 19 20 21 22 23 24 25 26 27 28 29 30 31 32 33 34 2.29 1.88 1.47 2.64 2.78 1.68 1.24 1.17 1.27 1.22 1.71 1.25 1.19 1.56 1.46 1.32 2 2.54 1.88 1.66 1.46 2.1 2.54 1.46 1.86 2.25 1.07 2.95 2.38 1.6 2.72 3.17 2.96 1.87 3.11 2.32 2.19 2.05 2.65 2.52 2.31 1.73 3.25 2.55 2.69 3.02 0.93 1.84 3.44 0.43 3.13 3 2.06 6.32 7.91 7.18 2.04 7.74 4.52 3.07 2.88 5.32 3.18 2.10 1.59 6.36 4.45 3.45 3.59 3.59 0.93 1.84 3.44 0.43 3.13 3.37 2.06 6.32 7.91 7.18 2.04 7.74 4.52 3.07 2.88 5.32 3.18 2.10 1.59 6.36 4.45 3.45 515.27 329.47 269.66 333.7 397.74 222.99 450.5 173.11 135.47 139.01 314.02 234.54 227.27 230.77 275.51 169.86 267.61 237.96 360 156.13 270.61 470.31 325.44 SC SD SD SD SC SD SC SE SE SE SD SD SD SD SD SE SD SD SD SE SD SC SD B.Distribution of Soil Vulnerability Index (K The use of microtremor was later expanded to identify the vulnerability index for ground (Nakamura, 1996, 1997, 2000, 2009; Daryono et al., 2009) [11]. Nakamura (1997) introduced a vulnerability index parameter (Kg), which combined A and F to determine soil damage level due to the local site effects. Thus, Kg can be considered as an index to indicated easiness of deformation of points which is expected useful to detect weak points of the ground. To estimate soil vulnerability index (K shear strain (γ) need to be considered (Nguyen, et.al., 2004). The vulnerability index (K from γ = 1000 x 10-6 ground begins to show non linear character and in γ > 10,000 x 10 deformation and collapse occur. Nakamura (1997) had written the equation 2 that as follows: ?=??×?? (?? 10−6) & ??≅ where αb is the acceleration of basement ground, A is amplification factor, F is the fundamental frequency of surface ground. Based on the effective strain can be estimated by multiplying K value with maximum acceleration of basement ground αb in Gal (cm/s2) and can be considered as an index to ) and can be considered as an index to ion of Soil Vulnerability Index (Kg) The use of microtremor was later expanded to identify the vulnerability index for ground (Nakamura, 1996, 1997, 2000, 2009; Daryono et al., 2009) [11]. Nakamura (1997) introduced a vulnerability index hich combined A and F to determine soil damage level due to the local site can be considered as an index to indicated easiness of deformation of points which is expected useful to detect weak points of the ground. bility index (Kg), the value of need to be considered (Nguyen, et.al., 2004). The vulnerability index (Kg) is limited in that ground begins to show non- Figure.12 the distribution of amplification factor values in the study area TABLE.I FREQUENCY, AMPLIFICATION FACTOR AND VULNERABILITY INDEX FOR STUDY AREA Amplif ication factor (A) 1 2.56 2.08 2 1.61 1.84 3 1.22 1.85 4 1.64 3.16 5 2.78 3.07 6 3.71 2.82 7 4.42 2.69 8 2.03 2.88 9 1.51 2.49 10 2.73 3.19 11 2.86 1.93 distribution of amplification factor AMPLIFICATION VULNERABILITY INDEX FOR Vulner ability index (Kg) 1.69 2.10 2.81 6.09 3.39 2.14 1.64 4.09 4.11 3.73 1.30 Freque ncy (F) Soil Profile Type Point Nos V (30) (30) VS > 10,000 x 10-6 large llapse occur. Nakamura (1997) 354.81 374.26 328.12 267.23 329.44 404.25 473.3 355.88 270.6 235.6 441.11 441.11 354.81 374.26 328.12 267.23 329.44 404.25 473.3 355.88 270.6 235.6 SD SC SD SD SD SC SC SD SD SD SC had written the equation 2 that as follows: ?2 (?? 10−6) (2) ? is the acceleration of basement ground, A is amplification factor, F is the fundamental frequency of surface ground. Based on the above equation, the effective strain can be estimated by multiplying Kg value with maximum acceleration of basement ground @ IJTSRD | Available Online @ www.ijtsrd.com www.ijtsrd.com | Volume – 3 | Issue – 1 | Nov-Dec Dec 2018 Page: 90
International Journal of Trend in Scientific Research and Development (IJTSRD) ISSN: 2456 International Journal of Trend in Scientific Research and Development (IJTSRD) ISSN: 2456 International Journal of Trend in Scientific Research and Development (IJTSRD) ISSN: 2456-6470 indicate easiness of deformation of measured points, which is expected to be useful to detect weak points of the ground. Figure. 13 shows the distribution of vulnerability index (Kg) having values ranging from 0.44 to 7.9. In this study, αb = 0.2 g (200 Gal) and = 800 m/s, for γ >1000 x 10-6 then the K and for γ > 10,000 x 10-6 the Kg value > 50. Based on the above criteria, for the value of K found and Kg > 5 was found at some points in this study area. Some area are found that vulnerability index (Kg) < 5. The minimum value of (K and maximum value of (Kg) is 7.9 for this study area. indicate easiness of deformation of measured points, useful to detect weak points Figure. 13 shows the distribution of ) having values ranging from = 0.2 g (200 Gal) and V then the Kg value > 5; value > 50. Based on (c) and Period (b) amplification g) value for each site the above criteria, for the value of Kg50 was not > 5 was found at some points in this study area. Some area are found that vulnerability ) < 5. The minimum value of (Kg) is 0.43 Fig.14 (a) Frequencies and Period (b) amplification factor (c) vulnerability (Kg C.Comparison between actual deformation and measured results In this study, table 1 shows the amplification fa frequency, shear waves and Soil Profile Type for study area. It was found that the higher vulnerability index (Kg) at the measured points 4 and 31 as shown in Fig. 8. Almost of these points are soil profile type SE. The pipe support found between these points. The worst damages were found between 5 to 10 miles far from Gyobyu reservoir. The frequencies (F) of above 6 points were lower than 1.7 HZ values and the vulnerability indexes (Kg) were great Kg index Kg is significantly related to the damage of pipe supports when the ground is not severely deformation. a result of the study of all measured points are shown in Fig. 11, 12, 13 and 14. V. CONCLUSION The microtremor records along Gyobyu pipeline a analyzed for 34 positions with Taikkyi area. An attempt has been made to interpret variations of microtremor H/V spectral ratios in terms of the local site effect. The main conclusions can be summarized as follows: ?Seismic waves travel through differen at different speeds. Comparison between actual deformation and ) is 7.9 for this study area. In this study, table 1 shows the amplification factor, frequency, shear waves and Soil Profile Type for study area. It was found that the higher vulnerability ) at the measured points 4, 19, 20, 21, 23, 27 and 31 as shown in Fig. 8. Almost of these points are . The pipe supports damage were found between these points. The worst damages were found between 5 to 10 miles far from Gyobyu reservoir. The frequencies (F) of above 6 points were values and the vulnerability > 5. The vulnerability is significantly related to the damage of pipe supports when the ground is not severely deformation. a result of the study of all measured points are shown The microtremor records along Gyobyu pipeline are analyzed for 34 positions with Taikkyi area. An attempt has been made to interpret variations of microtremor H/V spectral ratios in terms of the local site effect. The main conclusions can be summarized Figure.13 The distribution of vulnerability index (K values in the study area The following figures show frequencies, amplification factor and vulnerability (Kg) value for each site. Figure.13 The distribution of vulnerability index (Kg) The following figures show frequencies, amplification Seismic waves travel through different materials ) value for each site. ?Seismic waves travel through different materials with different amplitude. Seismic waves travel through different materials ?Bedrock has high frequency low (less destructive). ?Sediment has low-frequency high amplitude waves (more destructive). Therefore, the observe amplitude and frequency are reasonable for this concept. Site 4, 19, 20, 21, 22, 23, 27, 31 are more damage pipe support than other site. From the results, higher amplification is more destructive at pipe support in actual damage condition. There was not found pipe support damage here was not found pipe support damage Bedrock has high frequency low-amplitude waves (a) frequency high amplitude waves , the observe amplitude and frequency are reasonable for this concept. Site 4, 19, 20, 21, 22, 23, 27, 31 are more damage pipe support than other site. From the results, higher amplification is more destructive at pipe support in actual damage (b) @ IJTSRD | Available Online @ www.ijtsrd.com www.ijtsrd.com | Volume – 3 | Issue – 1 | Nov-Dec Dec 2018 Page: 91
International Journal of Trend in Scientific Research and Development (IJTSRD) ISSN: 2456 International Journal of Trend in Scientific Research and Development (IJTSRD) ISSN: 2456 International Journal of Trend in Scientific Research and Development (IJTSRD) ISSN: 2456-6470 4.Wathelet M, Jongmans D, Ohrnberger M. Surface-wave inversion using a direct search algorithm and its application to ambient vibration measurements. Near Surf Geophys2004;2(4):211 21. at that point. In higher value of Kg (Kg > 5) in some points, there are more damage of pipe supports other than points (Kg < 5) in recent earthquake. These results show that the weak location of the soil for this area, corresponding to recent earthquake, can retrofit the pipe supports at these location which reveal the necessity for an appropriate emergency management program. ACKNOWLEDGMENT I would like to appreciate greatly to Dr. Kyaw, Head of Civil Engineering Department, YTU, who gave me the permission to do this research, and Dr. Kyaw Kyaw, Civil Engineering Department, YTU, who supervised my whole work and Engineers, Water Work Association Department, YCDC, who helped and gave any necessary data for my REFERENCES 1.NogoshiM, IgarashiT. characteristics of microtremor (Part2). J Seismol Soc Jpn 1971; 24:26–40 (in Japanese abstract). 2.NakamuraY.A method for dynamic characteristics estimation of subsurface using microtr ground surface. Q Rep Railw Tech Res Inst 1989; 30:250–363. 3.Scherbaum F, HinzenK-G, Ohrnberger M. Determination of shallow shear wave velocity profiles in the Cologne/ Germany are a using ambient vibrations. GeophysJInt2003; 152:597 612. at that point. In higher value of Kg (Kg > 5) in some points, there are more damage of pipe supports other than points (Kg < 5) in recent earthquake. These results show that the weak location of the soil for this , corresponding to recent earthquake, can retrofit the pipe supports at these location which reveal the necessity for an appropriate emergency management elet M, Jongmans D, Ohrnberger M. wave inversion using a direct search algorithm and its application to ambient vibration measurements. Near Surf Geophys2004;2(4):211– 5.Sánchez-Sesma, F.J., et al. (2011): Theory for microtremor H/V spectral rat layered medium, GJI, DOI: 10.1111/j.1365 246X.2011.05064.x. 6.The 2017 M 5.1 Taikkyi earthquake, Tech Digest Quarterly Magazine Vol. 9/ No.4, July, 2017 page: 114 7.A. Susilo and P. Winoto, Microtremor Analysis of Area Using Horizontal to Vertical Spectral Ratio Methods,” Jurnal Geofisika 17-24 8.A. Keiiti, “Richards P Seismology,” University Science Book, Sausalito, California, the USA,2002 9.H. Dindar, Vulnerability Index Assessment using Neural Networks (VIANN): A case study of Nicosia, Cyprus, 4th International GeoAdvances Workshop, 14–15 October 2017, Safranbolu, Karabuk, Turkey 10.E. Fergany, K. Omar, Liquefaction potential of Nile delta, Egypt, NRIAG Journ and Geophysics http://dx.doi.org/10.1016/j.nrjag.2017.01.004 http://dx.doi.org/10.1016/j.nrjag.2017.01.004 Sesma, F.J., et al. (2011): Theory for spectral ratio: application for a , DOI: 10.1111/j.1365- I would like to appreciate greatly to Dr. Nyan Myint neering Department, YTU, who gave me the permission to do this research, and Kyaw Kyaw, Civil Engineering Department, YTU, who supervised my whole work and Engineers, Water Work Association Department, YCDC, who helped and gave any necessary data for my study case. The 2017 M 5.1 Taikkyi earthquake, Tech Digest Quarterly Magazine Vol. 9/ No.4, July, 2017 --- A. Susilo and P. Winoto, “Rudyanto A. Microtremor Analysis of Brawijaya University Area Using Horizontal to Vertical Spectral Ratio Jurnal Geofisika [J], vol. 1, 2010, PP. NogoshiM, characteristics of microtremor (Part2). J Seismol IgarashiT. On On the the amplitude amplitude Richards P. G. Quantitative Science Book, Sausalito, Japanese with English NakamuraY.A method for dynamic characteristics estimation of subsurface using microtremor on the ground surface. Q Rep Railw Tech Res Inst 1989; rability Index Assessment using Neural Networks (VIANN): A case study of Nicosia, Cyprus, 4th International GeoAdvances 15 October 2017, Safranbolu, G, Ohrnberger M. Determination of shallow shear wave velocity profiles in the Cologne/ Germany are a using ambient vibrations. GeophysJInt2003; 152:597– E. Fergany, K. Omar, Liquefaction potential of Nile delta, Egypt, NRIAG Journal of Astronomy and Geophysics 6 6 (2017) (2017) 60 60–67, @ IJTSRD | Available Online @ www.ijtsrd.com www.ijtsrd.com | Volume – 3 | Issue – 1 | Nov-Dec Dec 2018 Page: 92