Download
1 / 6
60 likes | 94 Vues
During the students life, learning is the main thing. But in students learning process, disability condition can cause barriers in education. Disability can have direct impact on students learning. Nature of the disability can display the learning capacity of students. There are many kind of disabilities like physical disabilities, visual impairment, hearing impairment, speech and language disorders, intellectual disabilities including learning disabilities and autism spectrum disorder. According to Census 2011, in India, out of 121 Cr population, about 2.68 Cr persons are disabled that means 2.21 of the total population. A large number of disabled individuals comprised both children and young adults in South 24 Parganas district of West Bengal. 14.71 were diagnosed as significant hearing impairments in the Medinipur Sadar Subdivision, Paschim Medinipur district, West Bengal. Finding displayed that majority of respondents was men than women. The disability rates was 1635 per 100000 population in Tamil Nadu according to 2011 Census. It was observed that the prevalence rate of students with learning disability varies from 10.76 to 13.41 with mean percentage of 12.31 in two districts of Haryana. Besides that, Prevalence of disability 100000 population by types, residence and sex in India, 2011 and the total number of individuals associated with disability in West Bengal Disability Census, 2011 is also written. To prevent disability, good nutrition is needed when the child is in womb. Care is also needed and it is necessary to hear the disabled persons voice or any kind of signals that he she delivers. Chiranjit Majumder "Prevalence of Disabled People in India" Published in International Journal of Trend in Scientific Research and Development (ijtsrd), ISSN: 2456-6470, Volume-3 | Issue-2 , February 2019, URL: https://www.ijtsrd.com/papers/ijtsrd21495.pdf Paper URL: https://www.ijtsrd.com/home-science/food-and-nutrition/21495/prevalence-of-disabled-people-in-india/chiranjit-majumder<br>

E N D
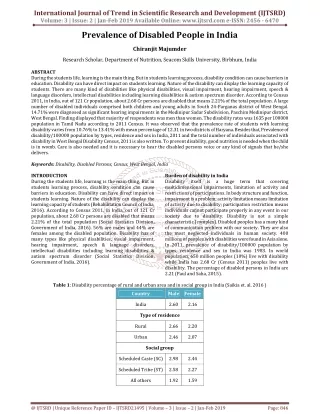
International Journal of Trend in Scientific Research and Development (IJTSRD) Volume: 3 | Issue: 2 | Jan-Feb 2019 Available Online: www.ijtsrd.com e-ISSN: 2456 - 6470 Prevalence of Disabled People in India Chiranjit Majumder Research Scholar, Department of Nutrition, Seacom Skills University, Birbhum, India ABSTRACT During the students life, learning is the main thing. But in students learning process, disability condition can cause barriers in education. Disability can have direct impact on students learning. Nature of the disability can display the learning capacity of students. There are many kind of disabilities like physical disabilities, visual impairment, hearing impairment, speech & language disorders, intellectual disabilities including learning disabilities & autism spectrum disorder. According to Census 2011, in India, out of 121 Cr population, about 2.68 Cr persons are disabled that means 2.21% of the total population. A large number of disabled individuals comprised both children and young adults in South 24-Parganas district of West Bengal. 14.71% were diagnosed as significant hearing impairments in the Medinipur Sadar Subdivision, Paschim Medinipur district, West Bengal. Finding displayed that majority of respondents was men than women. The disability rates was 1635 per 100000 population in Tamil Nadu according to 2011 Census. It was observed that the prevalence rate of students with learning disability varies from 10.76% to 13.41% with mean percentage of 12.31 in two districts of Haryana. Besides that, Prevalence of disability/100000 population by types, residence and sex in India, 2011 and the total number of individuals associated with disability in West Bengal Disability Census, 2011 is also written. To prevent disability, good nutrition is needed when the child is in womb. Care is also needed and it is necessary to hear the disabled persons voice or any kind of signals that he/she delivers. Keywords: Disability, Disabled Persons, Census, West Bengal, India INTRODUCTION During the students life, learning is the main thing. But in students learning process, disability condition can cause barriers in education. Disability can have direct impact on students learning. Nature of the disability can display the learning capacity of students (Rehabilitation Council of India, 2016). According to Census 2011, in India, out of 121 Cr population, about 2.68 Cr persons are disabled that means 2.21% of the total population(Social Statistics Division, Government of India, 2016). 56% are males and 44% are females among the disabled population. Disability has of many types like physical disabilities, visual impairment, hearing impairment, speech & language disorders, intellectual disabilities including learning disabilities & autism spectrum disorder(Social Statistics Division, Government of India, 2016). Table 1: Disability percentage of rural and urban area and in social group in India (Saikia et. al. 2016 ) Burden of disability in India Disability itself multidimensional impairments, limitation of activity and restrictions of participations. In body structure and function, impairment is a problem; activity limitation means limitation of activity due to disability; participation restriction means individuals cannot participate properly in any event in our society due to disability. Disability is not a simple characteristic (complex). Disabled peoples has a many kind of communication problem with our society. They are also the most neglected individuals in human society. 400 millions of peoples with disabilities were found in Asia alone. In 2011, prevalence of disability/100000 population by types, residence and sex in India was 1983. In world population, 650 million peoples (10%) live with disability while India has 2.68 Cr (Census 2011) peoples live with disability. The percentage of disabled persons in India are 2.21(Paul and Saha, 2015). is a huge term that covering Country Male Female India 2.60 2.16 Type of residence Rural 2.66 2.20 Urban 2.46 2.07 Social group Scheduled Caste (SC) 2.98 2.44 Scheduled Tribe (ST) 2.58 2.27 All others 1.92 1.59 @ IJTSRD | Unique Reference Paper ID – IJTSRD21495 | Volume – 3 | Issue – 2 | Jan-Feb 2019 Page: 846
International Journal of Trend in Scientific Research and Development (IJTSRD) @ www.ijtsrd.com eISSN: 2456-6470 Table 2: Age-standardized disability prevalence for Indian sub-populations and states (in %) (Saikia et. al. 2016) States Andhra Pradesh Assam Bihar Chhattisgarh Delhi Gujarat Haryana Himachal Pradesh Jammu & Kashmir Jharkhand Karnataka Kerala Madhya Pradesh Maharashtra Odisha Punjab Rajasthan Tamil Nadu Uttar Pradesh West Bengal Uttarakhand Goa Arunachal Pradesh Manipur Meghalaya Mizoram Nagaland Table 2: Age-standardized disability prevalence for Indian sub-populations and states (in %) (Saikia et. Al) States Sikkim Tripura Andaman & Nicobar islands Lakshadweep Chandigarh Puducherry Dadra & Nagar Haveli Daman & Diu Extension of Table 2 Male Female 3.04 1.88 2.72 3.07 1.76 2.10 2.58 2.60 3.54 2.89 2.42 2.44 2.56 3.02 3.40 2.66 3.00 1.83 2.46 2.53 2.20 2.39 2.56 2.20 1.85 1.75 2.07 2.56 1.77 2.15 2.67 1.45 1.75 2.11 2.08 3.08 2.46 2.02 1.99 2.10 2.38 2.96 2.11 2.67 1.45 2.03 2.12 1.81 2.20 2.54 1.94 1.71 1.55 1.97 Male Female 3.61 2.05 2.20 2.72 1.67 2.79 1.28 1.21 3.68 1.75 1.85 2.66 1.42 2.21 1.16 1.16 Table 3: Prevalence of disability/100000 population by types, residence and sex in India, 2011 Disability In seeing In hearing In speech In movement Mental disability Mental Retardation Mental Illness Any Other Multiple Disability Total Source: Census of India, 2011 No. of individuals 392 432 169 294 - 111 52 404 128 1983 @ IJTSRD | Unique Reference Paper ID – IJTSRD21495 | Volume – 3 | Issue – 2 | Jan-Feb 2019 Page: 847
International Journal of Trend in Scientific Research and Development (IJTSRD) @ www.ijtsrd.com eISSN: 2456-6470 Table 4: West Bengal Disability Census, 2011 Age Group Total 0-4 82491 5-9 132038 10-19 334013 20-29 319203 30-39 281601 40-49 277116 50-59 222050 60-69 192803 70-79 115677 80-89 43062 90+ 14350 Age Not Stated 3002 Total 2017406 1127181 890225 Table 5: West Bengal Disability Census, 2011 Male 43841 72742 185773 181629 161631 162907 129857 103419 57575 20229 5913 1665 Female 38650 59296 148240 137574 119970 114209 92193 89384 58102 22833 8437 1337 Mentally Retarded 4087 9022 30021 27342 23455 19729 11809 6854 2815 832 343 214 136523 Mentally Illness 687 2627 10869 12841 13668 12742 8564 5544 2689 937 275 72 71515 Multiple Disability 7275 16427 38841 28003 20666 18957 16079 19753 17658 9070 3606 166 196501 Age Group Seeing Hearing Speaking Movement Others 0-4 5-9 10-19 20-29 30-39 40-49 50-59 60-69 70-79 80-89 90+ 17639 23245 59293 54386 52910 60181 55265 53553 32758 11162 3386 695 424473 14260 19725 49354 46645 43810 43532 35171 32001 20211 7512 2385 586 315192 2359 16087 34720 27508 22376 19576 12141 7613 3339 966 421 230 147336 8029 13426 42751 49373 43803 43703 43145 40665 23713 8650 2426 261 322945 28155 31479 68164 73105 60913 55696 39876 26820 12494 3933 1508 778 402921 Age Not Stated Total Burden of Disability in South 24-Parganas, West Bengal A study was done on Evaluation of registered visually disabled individuals in a district of West Bengal, India. 155 (310 eyes) visually disabled individuals were involved in this study from medical records of South 24-Parganas district. 131 (84.52%) individuals had 100% disability. The higher number of disabled individuals were males than in females. 58 (37.42%) disabled individuals were below 21 years of age. A large number of disabled individuals comprised both children and young adults(Ghosh et.al. 2008). Prevalence of Hearing Impairment in the Paschim Medinipore district, West Bengal, India A study was occurred on Prevalence of Hearing Impairment in the Medinipur Sadar Subdivision, Paschim Medinipore district, West Bengal, India. 700 individuals were involved in this study. The procedure taken includes interviews, questionnaires, and physical examination and Audiology Division of Midnapore Rehabilitation Centre for Children, Midnapore. Out of 700 individuals, 103 (14.71%) were diagnosed as significant hearing impairments. Finding displayed that majority of respondents was men than women (Chatterjee and Bhuniya, 2012). @ IJTSRD | Unique Reference Paper ID – IJTSRD21495 | Volume – 3 | Issue – 2 | Jan-Feb 2019 Page: 848
International Journal of Trend in Scientific Research and Development (IJTSRD) @ www.ijtsrd.com eISSN: 2456-6470 Burden of Disability in Tamil Nadu, India A study was occurred on Prevalence of hearing impairment in school children (aged 8-14 years) in the villages of Vadamavanthal, Tamil Nadu, India. Using pre-tested questionnaire, the school students were interviewed and aural examination was completed by a qualified otolaryngologist. Among 700 school children between the age of 8-14 years, this study was conducted. Among 700 school children 216 (30.9%) were suffering from hearing impairment. In the age group of 8 years, it was more prevalent followed the age group of 14 years. Hearing impairments can leads to poor academic achievement and can affect the child’s vocational choices in future(Norman et. al. 2016). Another study was found on Prevalence of disability in Tamil Nadu, India. Here is the analysis of disability rates per 100000 population based on the 2011 Census cross- sectional survey data of Tamil Nadu. 1179963 disabled individuals were found in Tamil Nadu according to 2011 Census. The disability rates was 1635 per 100000 population. Movement disability, hearing disability and sight disability accounted for 24%, 19% and 11% of total respectively. Physical and mental disability were found in 1.6% of the population of Tamil Nadu (Velayutham et. al. 2017). Table 6: Age-standardized disability rates per 100000 individuals according to the type of disability in districts of Tamil Nadu, 2011 District Disability rates per 100000 individuals Seeing 204 226 186 167 186 190 137 174 161 152 139 143 162 190 231 220 200 238 148 164 177 181 148 148 186 212 169 145 203 172 168 123 176.56 Extension of Table 6 Hearing 499 501 341 261 249 312 180 253 246 208 327 170 196 368 357 372 258 446 225 217 342 275 317 223 349 303 272 295 269 270 352 245 296.81 Speech 97 86 93 116 137 121 96 101 111 85 133 113 109 198 192 101 114 149 107 124 120 100 155 118 124 115 109 106 136 126 92 94 118.06 Movement 358 298 382 407 403 480 390 447 408 343 335 408 407 393 496 362 471 486 414 386 447 380 411 428 390 512 477 454 507 416 288 310 409.18 Thiruvallur Chennai Kancheepuram Vellore Tiruvanamalai Viluppuram Selam Namakkal Erode Nilgiris Dindigul Karur Tiruchirappalli Perambalur Ariyalur Cuddalore Nagapattinam Thiruvarur Thanjavur Pudukkottai Sivaganga Madurai Theni Virudhunagar Ramanathapurum Thoothukkudi Tirunelveli Kanniyakumari Dharmapuri Krishnagiri Coimbatore Tiruppur Average @ IJTSRD | Unique Reference Paper ID – IJTSRD21495 | Volume – 3 | Issue – 2 | Jan-Feb 2019 Page: 849
International Journal of Trend in Scientific Research and Development (IJTSRD) @ www.ijtsrd.com eISSN: 2456-6470 Table 7: Age-standardized disability rates per 100000 individuals according to the type of disability in districts of Tamil Nadu, 2011 Disability rates per 100000 individuals Mental retardation Mental illness Multiple Any other Thiruvallur 132 Chennai 119 Kancheepuram 140 Vellore 138 Tiruvanamalai 136 Viluppuram 120 Selam 115 Namakkal 131 Erode 133 Nilgiris 139 Dindigul 129 Karur 130 Tiruchirappalli 162 Perambalur 146 Ariyalur 148 Cuddalore 137 Nagapattinam 183 Thiruvarur 162 Thanjavur 166 Pudukkottai 150 Sivaganga 168 Madurai 144 Theni 145 Virudhunagar 150 Ramanathapurum 160 Thoothukkudi 172 Tirunelveli 170 Kanniyakumari 178 Dharmapuri 127 Krishnagiri 115 Coimbatore 124 Tiruppur 108 Average 143.03 Extension of Table 7 Table 8: Average disability (seeing, hearing, speech, movement, mental retardation, mental illness, multiple, any other) rates per 100000 individuals in Tamil Nadu state. Disability rates per 100000 individuals Seeing Hearing Speech Movement Mental retardation Mental illness Multiple Any other Average 176.56 296.81 118.06 409.18 District 36 57 44 42 36 36 33 34 49 42 38 43 47 37 43 32 69 61 58 53 52 42 40 43 49 76 60 86 38 30 38 39 46.34 135 103 119 136 134 131 107 114 139 117 115 129 128 136 171 119 167 160 139 156 163 108 129 141 134 141 135 153 156 116 102 119 132.87 566 539 442 309 278 337 189 228 261 268 304 157 263 371 354 310 283 369 248 277 327 316 333 235 342 262 280 447 279 313 324 300 315.96 District 143.03 46.34 132.87 315.96 @ IJTSRD | Unique Reference Paper ID – IJTSRD21495 | Volume – 3 | Issue – 2 | Jan-Feb 2019 Page: 850
International Journal of Trend in Scientific Research and Development (IJTSRD) @ www.ijtsrd.com eISSN: 2456-6470 Prevalence of learning disabled students in two districts of Haryana A study was occurred on Identification and prevalence of learning disabled students in Haryana. This study objective was to identify and know the prevalence of learning disability among class fifth children. The sample consisted of all the students studying in class fifth of five schools in Kurusshetra and Jind districts of Haryana. The tools used were both informal and formal academic result of previous class (English and mathematics), Checklist for identifying learning disabled students by teachers/parents, Ravens progressive matrices (intelligence test) and Diagnostic test of learning disability (Swaroop and Mehta 2005). It was observed that the prevalence rate of students with learning disability varies from 10.76% to 13.41% with mean percentage of 12.31 (Kumar and Suman, 2017). Table 9: Prevalence of students with learning disabilities in five school of Haryana (Velayutham et. al. 2017) Number of students with learning disability 11 8 6 10 7 42 Serial Number School Name Number of students Percentage of students 1. 2. 3. 4. 5. School I School II School III School IV School V Total 82 68 53 73 65 341 13.41 11.76 11.32 13.69 10.76 12.31 Summary and Conclusion According to Census 2011, in India, out of 121 Cr population, about 26.8 Cr persons are disabled that means 2.21% of the total population. The percentage of disabled persons in India are 2.21. A large number of disabled individuals comprised both children and young adults in South 24-Parganas district of West Bengal. 14.71% were diagnosed as significant hearing impairments in the Medinipur Sadar Subdivision, Paschim Medinipore district, West Bengal. . Finding displayed that majority of respondents was men than women. 1179963 disabled individuals were Census. The disability rates was 1635 per 100000 population. Movement disability, hearing disability and sight disability accounted for 24%, 19% and 11% of total respectively. Physical and mental disability were found in 1.6% of the population of Tamil Nadu. It was observed that the prevalence rate of students with learning disability varies from 10.76% to 13.41% with mean percentage of 12.31in two districts of Haryana. It is concluded from the present review that prevalence of disabled persons in India. Magnitude of disability is more observed in males than in females. Future Scope The present review displays that disability is major public health problems in India, their magnitude (prevalence) is estimated in 2011 Census. Possibly, It is hoped that again will census will happen in 2019. In future, many study can be done with about disabled persons. Following below study may be good about disabled persons in future. Census is needed again to know the burden of disabled person in India. Small study is also needed to know the percentage of magnitude persons in many places of India. Many types of disability is observed in India, that is why, every types need separately studied. Study may be done on problems of disabled persons. Further research may be conducted on disabled persons by taking variables like attention, interest, intelligence, academic performance and motivation, parents and teachers attitude. A comparison can also be studied between disabled children who study in special school and those who study in other schools with normal children. Acknowledgements I, express my sincere gratitude to all the contributors of this paper. Special thanks to all the authors of the papers mentioned below in reference list. References [1]Chatterjee and Bhuniya, (2012), Prevalence of hearing impairment in the Medinipur Sadar Subdivision, Paschim Medinipore district, West Bengal, India, International Journal of Science and Research, 3(10): 786-791. [2]Ghosh S, Mukhopadhyay S, Sarkar K, Bandyopadhyay M, Maji D, Bhaduri G, (2008), Evaluation of registered visually disabled individuals in a district of West Bengal, India, Indian Journal of Community Medicine, 33(3): 168-171. [3]Kumar and Suman, (2017), Identification and prevalence of learning disabled students, International Journal of Scientific and Research Publications, 7(3): 317-319. [4]Norman P, Chandran M, Dhandapani T, (2016), Prevalence of hearing impairment in school children (aged 8-14 years) in the villages of Vadamavanthal, Tamil Nadu, India, International Journal of Community Medicine and public Health, 3(12): 3369-3373. [5]Paul and Saha, (2015), Burden of disability in India, Journal of Multidisciplinary Research in Healthcare, 2(1): 31-54. [6]Rehabilitation Council of India, (2016), Disability and Implications on Learning, 1-90. [7]Saikia N, Bora JK, Jasilionis D, Shkolnikov VM, (2016), Disability Divides in India: Evidence from the 2011 Census, PLoS doi:10.1371/journal.pone.0159809. ONE, 11(8)e0159809, [8]Social Statistics Division, Government of India, (2016), Disabled Persons in India: A statistical profile 2016, 1- 107. [9]Velayutham B, Kangusamy B, Mehendale S, (2017), Prevalence of disability in Tamil Nadu, India, The National Medical Journal of India, 30(3): 125-130. @ IJTSRD | Unique Reference Paper ID – IJTSRD21495 | Volume – 3 | Issue – 2 | Jan-Feb 2019 Page: 851