Download
1 / 5
50 likes | 65 Vues
We present rotation measurements performed with a passive resonant optical fibre gyroscope. The fibre used to realize the resonant cavity was a Kagome Hollow Core Fiber. Measurements were performed in two types of configurations. In the first configuration, the counter propagating beams resonate on the same cavity mode. This leads to observation of lock in that prevents measuring rotation rates below roughly 1u00c2u00b0 s. In the second configuration, the counter propagating beams resonate on two different cavity modes. This leads to rotation rates measurements below 0.1u00c2u00b0 s that are currently limited by some drifts. We will describe in the conference possible sources of drifts and the solutions we consider to circumvent them. Dr. Vinay Kumar Chaudhary "Study of Rotation Measurements with a Passive Resonant Gyroscope Based on Hollow Core Fiber" Published in International Journal of Trend in Scientific Research and Development (ijtsrd), ISSN: 2456-6470, Volume-3 | Issue-5 , August 2019, URL: https://www.ijtsrd.com/papers/ijtsrd26390.pdf Paper URL: https://www.ijtsrd.com/physics/other/26390/study-of-rotation-measurements-with-a-passive-resonant-gyroscope-based-on-hollow-core-fiber/dr-vinay-kumar-chaudhary<br>

E N D
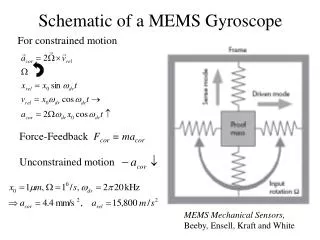
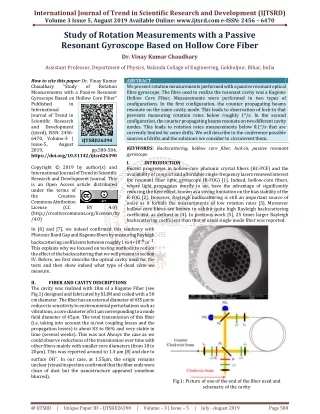
International Journal of Trend in Scientific Research and Development (IJTSRD) Volume 3 Issue 5, August 2019 Available Online: www.ijtsrd.com e-ISSN: 2456 – 6470 Study of Rotation Measurements with a Passive Resonant Gyroscope Based on Hollow Core Fiber Dr. Vinay Kumar Chaudhary Assistant Professor, Department of Physics, Nalanda Collage of Engineering, Gokhulpur, Bihar, India How to cite this paper: Dr. Vinay Kumar Chaudhary "Study Measurements with a Passive Resonant Gyroscope Based on Hollow Core Fiber" Published in International Journal of Trend in Scientific Research and Development (ijtsrd), ISSN: 2456- 6470, Volume-3 | Issue-5, August 2019, https://doi.org/10.31142/ijtsrd26390 Copyright © 2019 by author(s) and International Journal of Trend in Scientific Research and Development Journal. This is an Open Access article distributed under the terms of the Creative Commons Attribution License (CC (http://creativecommons.org/licenses/by /4.0) In [6] and [7], we indeed confirmed this tendency with Photonic Band Gap and Kagome fibers by measuring Rayleigh backscattering coefficients between roughly 1 to 4×10⁻⁶ m-1. This explains why we focused on testing methods to reduce the effect of the backscattering that we will present in section IV. Before, we first describe the optical cavity used for the tests and then show indeed what type of dead zone we measure. II. FIBER AND CAVITY DESCRIPTIONS The cavity was realized with 18m of a Kagome Fiber (see Fig.1) designed and fabricated by XLIM and coiled with a 50 cm diameter. The fiber has an external diameter of 435 µm to reduce its sensitivity to environmental perturbations such as vibrations, a core diameter of 61 µm corresponding to a mode field diameter of 45µm. The total transmission of this fiber (i.e. taking into account the in/out coupling losses and the propagation losses) is about 83 to 86% and very stable in time (several weeks). This was not Always the case as we could observe reductions of the transmission over time with other fibers mainly with smaller core diameters (from 10 to 20µm). This was reported around to 1.4 µm [8] and due to surface OH–. In our case, at 1.55µm, the origin remains unclear (visual inspection confirmed that the fiber ends were clean of dust but the nanostructure appeared somehow blurred). ABSTRACT We present rotation measurements performed with a passive resonant optical fibre gyroscope. The fibre used to realize the resonant cavity was a Kagome Hollow Core Fiber. Measurements were performed in two types of configurations. In the first configuration, the counter propagating beams resonate on the same cavity mode. This leads to observation of lock-in that prevents measuring rotation rates below roughly 1°/s. In the second configuration, the counter propagating beams resonate on two different cavity modes. This leads to rotation rates measurements below 0.1°/s that are currently limited by some drifts. We will describe in the conference possible sources of drifts and the solutions we consider to circumvent them. KEYWORDS: Backscattering, hollow core fiber, lock-in, passive resonant gyroscope I. INTRODUCTION Recent progresses in hollow-core photonic crystal fibers (HC-PCF) and the availability of compact and affordable single-frequency lasers renewed interest for resonant fiber optic gyroscope (R-FOG) [1]. Indeed, hollow-core fibers, where light propagates mostly in air, have the advantage of significantly reducing the Kerr effect, known as a strong limitation on the bias stability of the R-FOG [2]. However, Rayleigh backscattering is still an important source of noise as it forbids the measurements of low rotation rates [3]. Moreover hollow-core fibres are known to exhibit quite high Rayleigh backscattering coefficient, as defined in [4]. In previous work [5], 25 times larger Rayleigh backscattering coefficient than that of usual single mode fiber was reported. of Rotation IJTSRD26390 pp.580-584, BY 4.0) Fig.1: Picture of one of the end of the fiber used and schematic of the cavity @ IJTSRD | Unique Paper ID – IJTSRD26390 | Volume – 3 | Issue – 5 | July - August 2019 Page 580
International Journal of Trend in Scientific Research and Development (IJTSRD) @ www.ijtsrd.com eISSN: 2456-6470 frequency. Under rotation, the frequencies are different because of the Sagnac effect [12]. We plot the gyroscope response curve in Fig. 4, i.e the difference between the two AOM frequencies versus the rotation rate. Above 10°/s, the response is linear. The scale factor is about 5 kHz/(°/s), in agreement with an approximate (because of the real geometry of the cavity and its free-space coupler) value that can be calculated using the usual formula 4Æ n = 2r n =5.8 kHz/(°/s) ßL 180ß 180 where A = nr2, L = 2nr and 2r the cavity diameter. Below 10°/s, the response tends to shift away from this ideal linear response. Below 5 to 6°/s, the behavior of the gyroscope becomes noisy and chaotic, switching from a state where the AOMs frequencies are identical (locked state) to a transient state where they tend to be different making a more quantitative analysis more difficult. The cavity coupling is realized in free-space with lenses L1, L2, L3 and M1 mirror. M2 is a HR mirror and is used to monitor the intracavity resonance through its leakage and used to ease the alignment. The cavity is fiber-coupled to the external probe beams through lenses L1. Its resonance curves, obtained by injecting a clockwise beam in the cavity, are shown in Fig. 2 and give a finesse, defined as the ratio of the resonance peak Full Width Half Max over the Free Spectral range, of 33 and a contrast, defined as the ratio between the difference of the maximum and minimum signals over the maximum one, close of 80%. The values are close to what can be expected when simulating the cavity taking into account the coupler M1 transmission of 6.6%. The Free Spectral Range (FSR) is equal to 16.1 MHz. On the contrary to what we reported in [9] based on [10], λ/2 wave plates are required to control the polarization inside the cavity. This is because the fiber is much more rigid and cannot be twisted without risk of breaking it. Fig. 4: gyroscope response curve In Fig. 5 below, we show the difference between the frequencies of the RF signals applied to the two AOMs without rotation (except earth). It is in the few Hz range and we believe is a signature of the lock-in phenomenon. Fig.2: Resonance curves. Purple: transmitted beam detected on the photodiode PD4 thru leakage of M2 (transmission < 0.01%). Blue: reflected beam detected by a photodiode connected in place of the fiber injecting the counter-clockwise beam. Yellow: voltage applied to the probe laser III. The complete schematics of the gyroscope is given in Fig. 3 and is similar to has been previously reported. OBSERVATION OF A LOCK-IN ZONE Fig. 5: time evolution (in s) of the frequency without applied rotation IV. METHOD TO REDUCE THE DEAD ZONE Several methods have been proposed in the literature such as suppression of the carriers [13]. An illustration of its beneficial effects can be found in [16] for instance. More sophisticated versions with complex modulation schemes were also demonstrated in [14],[15]. However, as pointed out in [16], the effectiveness of this technique is limited by the carrier suppression level. Fig. 3: complete gyroscope schematic with the injection setup including The external laser is split into two beams that are frequency shifted by the acousto-optic modulators (AOM) to resonate with the same mode of the cavity. The AOMs are used to compensate the relative variations between the laser and the cavity mode frequencies. The AOM frequencies are driven through a Pound Drever Hall locking scheme [11]. Without rotation, the RF signals applied to the AOM have the same @ IJTSRD | Unique Paper ID – IJTSRD26390 | Volume – 3 | Issue – 5 | July - August 2019 Page 581
International Journal of Trend in Scientific Research and Development (IJTSRD) @ www.ijtsrd.com eISSN: 2456-6470 We propose to test a different method in which we probe the cavity with counter-propagating beams that resonate with different modes of the cavity. This ensures that, even without rotation, the frequency splitting is not null. We tested this configuration with two AOMs inducing frequency shifts centered around +110MHz and -110MHz so that the counter propagating beams are frequency- separated by 13 FSR. Indeed, we were able to measure rotation rates down to 0.05°/s as can be seen on the improved gyroscope response curve given in Fig. 6. However, at such low rotation rates, the measurements begin to be limited by slow fluctuations of the AOMs frequencies without rotation as can be seen in Fig. 7. This can be easily understood as the frequency splitting between the two counter propagating waves in this configuration depends not only of the Sagnac shift but also on the FSR that is prone to fluctuate. However, when using two AOMs of the same order (+1), so that the two resonating beam frequencies are only separated by one FSR, we did not observe the reduction (by a factor of roughly 20) of these drifts that we expected. V. METHOD TO MEASURE BOTH THE CAVITY FREE SPECTRAL RANGE AND THE ROTATION RATE We previously reported such an architecture [17] in which the laser beam was separated into three beams, two of them circulating in the same direction in the cavity while the third one was counter circulating. One of them is used to lock the laser while the two others are, as described in the section III of this paper, frequency shifted by two AOMs. Each beam is locked on a different resonance and the FSR and rotation rate can be retrieved from the frequencies applied to the AOMs. However we believe this solution faces some limitations due the locking of the laser (but it would be the same if the cavity length were locked on a stable reference laser). If for some reasons, the laser is not at resonance anymore with the cavity, the control loop will apply a correction signal to the laser so that its frequency converges toward the cavity resonance in a time depending on the control loop bandwidth. However, this transient time during which the laser frequency varies also impacts the AOM control loops and induces some noises in the AOM frequencies. We thus tested a configuration (see Fig. 8) in which the laser is not locked (frequency or shifts will impact in the same manner the three beams) using three AOMs inducing frequency shifts of 110, -110 and 42MHz. Fig. 8: schematic of the gyroscope configuration with three AOMs. The cavity FSR is now 16.4 MHz Without rotation, combining the three AOM frequencies gives three measurements of 13, 9 and 4 FSRs. The FSR results are given in Fig. 9. As can be seen the FSR are rather stable but there is a bias in the measurements. Fig.6: improved gyroscope response curve without lock-in Fig.7: Sagnac response of the gyroscope at a rotation rates of ±0.05°/s. In order to retrieve the Sagnac phase shifts, the AOMs frequency must be added explaining the average value of 225 MHz. We thus decided to implement a method to measure the FSR and the rotation rate simultaneously that we describe in the next section. Fig. 9: FSR measurements (in Hz) deduced from the frequencies of the three AOMs When one looks closer at the evolution of the three signals, further problems appear, as shown in Fig. 10. The scales of the fluctuations are not identical even when the curves seem @ IJTSRD | Unique Paper ID – IJTSRD26390 | Volume – 3 | Issue – 5 | July - August 2019 Page 582
International Journal of Trend in Scientific Research and Development (IJTSRD) @ www.ijtsrd.com eISSN: 2456-6470 to overlap. We are thus investigating the origins of these discrepancies that could be many. Residual Amplitude Modulation (RAM) could be one of the sources but we implemented the scheme described in [18] and we do not see any signature (at least with our level of accuracy) in the electrical spectrums of the intensities after the phase modulators. We are also investigating the symmetry of the resonance peaks that is known to induce a bias if not good enough. REFERENCES [1]G. A. Sanders, L. K. Strandjord, and T. Qiu, “Hollow core fiber optic ring resonator for rotation sensing”, in Optical Fiber Sensors 2006 (Optical Society of America, 2006), paper ME6 [2]K. Iwatsuki, K. Hotate, and M. Higashiguchi, “Kerr effect in an optical passive ring-resonator gyro,” J. Light wave Technol. 4, 645 (1986) [3]F. Zarinetchi et S. Ezekiel, “Observation of lock-in behavior in a passive resonator gyroscope”, Opt. Lett. 11, 401 (1986). [4]P. Gysel, and R. K. Staubli (1990), “Statistical properties of Rayleigh backscattering in single-mode fibers”, Journal of Light wave Technology 8(4), 561-567. [5]S. Lloyd, V. Dangui, M. Digonnet, S. Fan, and G. S. Kino, “Measurement of reduced backscattering noise in laser-driven fiber optic gyroscopes,” Opt. Lett., vol. 25, no. 2, pp. 121–123, 2010. [6]A. Ravaille, G. Feugnet, I. Fsaifes, A. Baz, B. Debord, F. Gérôme, G. Humbert, F. Benabid and F. Bretenaker, (2017). In-situ measurement of backscattering in hollow-core fiber based resonant cavities. IEEE Photonics Journal, 9(4), 1-7. [7]A. Ravaille, G. Feugnet, B. Morbieu, I. Fsaifes, A. Baz, B. Debord, G. Humbert, F. Benabid and F. Bretenaker (2017, June). Measurement of backscattering in hollow core photonic crystal fiber based resonant cavities. In Lasers and Electro-Optics Europe & European Quantum Electronics Conference (CLEO/Europe-EQEC, 2017 Conference on) (pp. 1-1). IEEE. [8]I. Gris-Sanchez and J.C. Knight (2012). Time-dependent degradation of photonic crystal fiber attenuation around OH absorption wavelengths. Journal of Light wave Technology, 30(23), 3597-3602. [9]I. Fsaifes, G. Feugnet, A. Baz, A. Ravaille, B. Debord, F. Gérôme, G. Humbert, S. Schwartz, F. Benabid and F. Bretenaker (2016, June). Hollow-core photonic- bandgap fiber resonator for rotation sensing. In Lasers and Electro-Optics (CLEO), 2016 Conference on (pp. 1- 2). IEEE. [10]M. Terrel, M. J.F. Digonnet, and S. Fan, “Polarization controller for hollow-core fiber”, Opt. Lett. 32, 1524 (2007). [11]R. W. P. Drever, J.L. Hall, F.V. Kowalski, J. Hough, G. M. Ford, A.J. Munley, H. Ward, H. (1983). Laser phase and frequency stabilization using an optical resonator. Applied Physics B, 31(2), 97-105. Fig. 10: zoom on the FSR variations deduced from the measurements of 4, 9 and 13 FSR. VI. We report, for what we believe is the first time, observation on the phenomenon of lock-in a passive resonant gyroscope with hollow-core fiber. We demonstrated that this issue can be solved by probing the cavity on two different modes. Indeed, this approach leads to a reduction of the lock-in threshold by several orders of magnitude. However, the sensitivity of the gyroscope is then limited by the FSR fluctuations. We propose and test architecture to measure both the rotation rate and the FSR simultaneously. We also present our ongoing efforts to reduce the discrepancies in the FSR measurements for this architecture to enhance the gyroscope performances. We will report at the conference our latest progress in this direction. CONCLUSON [12]G. Sagnac (1913). L'éther lumineux démontré par l'effet du vent relatif d'éther dans un interféromètre en rotation uniforme. CR Acad. Sci., 157, 708-710. [13]K. Iwatsuki, K. Hotate and M. Higashiguchi (1984). Effect of Rayleigh backscattering in an optical passive ring-resonator gyro. Applied Optics, 23(21), 3916- 3924. [14]K. Hotate, K. Takiguchi, and A. Hirose, ‘‘Adjustment-free method to eliminate the noise induced by the backscattering in an optical passive ring-resonator gyro,’’ IEEE Photon. Technol. Lett., vol. 2, no. 1, pp.75- 77, Jan. 1990. @ IJTSRD | Unique Paper ID – IJTSRD26390 | Volume – 3 | Issue – 5 | July - August 2019 Page 583
International Journal of Trend in Scientific Research and Development (IJTSRD) @ www.ijtsrd.com eISSN: 2456-6470 [15]K. Suzuki, K. Takiguchi, and K. Hotate, “Monolithically integrated resonator micro optic gyro on silica planar lighwave circuit,” J. Lightw. Technol., vol. 18, no. 1, pp. 66–72, Jan. 2000. Humbert, F. Benabid, I. Fsaifes and F. Bretenaker (2017, November). New approaches in optical rotation sensing. In International Conference on Space Optics— ICSO 2014 (Vol. 10563, p. 105633Y). International Society for Optics and Photonics. [16]H. Ma, Z. He and K. Hotate (2011). Reduction of backscattering induced noise by carrier suppression in waveguide-type optical ring resonator gyro. Journal of Lightwave Technology, 29(1), 85-90. [18]W. Zhang, M. J. Martin, C. Benko, J. L. Hall, J. Ye, C. Hagemann, T. Legero, U. Sterr, F. Riehle, G. D. Cole and M. Aspelmeyer (2014). Reduction of residual amplitude modulation to 1× 10⁻⁶ for frequency modulation and laser stabilization. Optics letters, 39(7), 1980-1983 [17]S. Schwartz, G. Feugnet, .B. Morbieu, N. El Badaoui, G. @ IJTSRD | Unique Paper ID – IJTSRD26390 | Volume – 3 | Issue – 5 | July - August 2019 Page 584