Download
1 / 8
80 likes | 111 Vues
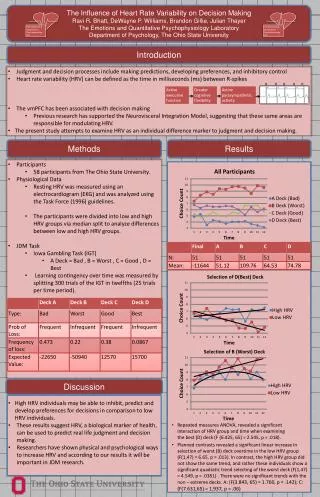
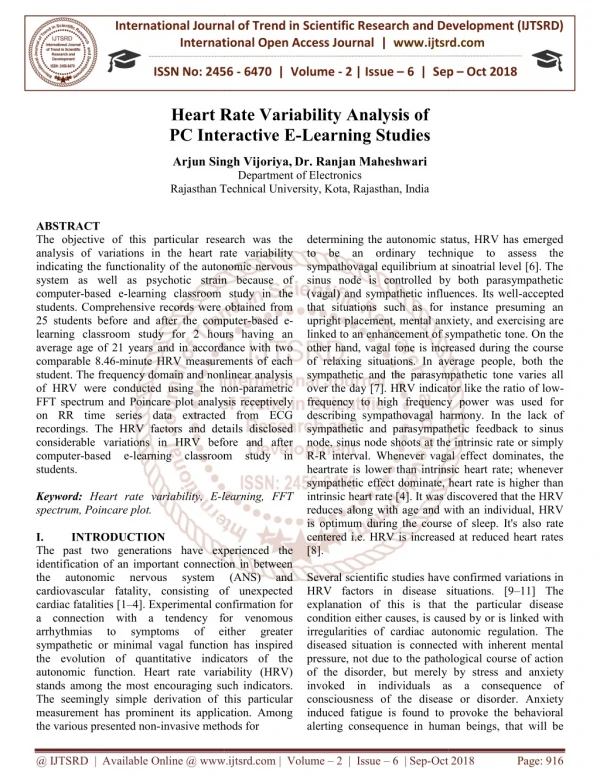
The objective of this particular research was the analysis of variations in the heart rate variability indicating the functionality of the autonomic nervous system as well as psychotic strain because of computer based e learning classroom study in the students. Comprehensive records were obtained from 25 students before and after the computer based e learning classroom study for 2 hours having an average age of 21 years and in accordance with two comparable 8.46 minute HRV measurements of each student. The frequency domain and nonlinear analysis of HRV were conducted using the non parametric FFT spectrum and Poincare plot analysis receptively on RR time series data extracted from ECG recordings. The HRV factors and details disclosed considerable variations in HRV before and after computer based e learning classroom study in students. Arjun Singh Vijoriya | Dr. Ranjan Maheshwari "Heart Rate Variability Analysis of PC Interactive E-Learning Studies" Published in International Journal of Trend in Scientific Research and Development (ijtsrd), ISSN: 2456-6470, Volume-2 | Issue-6 , October 2018, URL: https://www.ijtsrd.com/papers/ijtsrd18644.pdf Paper URL: http://www.ijtsrd.com/engineering/bio-mechanicaland-biomedical-engineering/18644/heart-rate-variability-analysis-of-pc-interactive-e-learning-studies/arjun-singh-vijoriya<br>

E N D
International Journal of Trend in International Open Access Journal International Open Access Journal | www.ijtsrd.com International Journal of Trend in Scientific Research and Development (IJTSRD) Research and Development (IJTSRD) www.ijtsrd.com ISSN No: 2456 ISSN No: 2456 - 6470 | Volume - 2 | Issue – 6 | Sep 6 | Sep – Oct 2018 Heart Rate Variabi PC Interactive PC Interactive E-Learning Studies Arjun Singh Vijoriya,Dr. Ranjan Maheshwari Department of Electronics Rajasthan Technical University, Kota,Rajasthan, India Heart Rate Variability Analysis of Arjun Singh Vijoriya Rajasthan Technical University, Kota, ABSTRACT The objective of this particular research was the analysis of variations in the heart rate variability indicating the functionality of the autonomic nervous system as well as psychotic strain because of computer-based e-learning classroom study in the students. Comprehensive records were obtained from 25 students before and after the computer learning classroom study for 2 hours having an average age of 21 years and in accordance with two comparable 8.46-minute HRV measurements of each student. The frequency domain and nonlinear analysis of HRV were conducted using the non FFT spectrum and Poincare plot analysis receptively on RR time series data extracted from ECG recordings. The HRV factors and deta considerable variations in HRV before and after computer-based e-learning classroom study in students. Keyword: Heart rate variability, E-learning, spectrum, Poincare plot. I. INTRODUCTION Thepast two generations have experienced the identification of an important connection in between the autonomic nervous cardiovascular fatality, consisting of unexpected cardiac fatalities [1–4]. Experimental confirmation for a connection with a tendency for venomous arrhythmias to symptoms sympathetic or minimal vagal function has inspired the evolution of quantitative indicators of the autonomic function. Heart rate variability (HRV) stands among the most encouraging such i The seemingly simple derivation of this particular measurement has prominent its application. Among the various presented non-invasive methods for invasive methods for determining the autonomic status, HRV has emerged to be an ordinary technique to assess the sympathovagal equilibrium at sinoatrial level [6]. The sinus node is controlled by both parasympathetic (vagal) and sympathetic influences. Its well that situations such as for instance presuming an upright placement, mental anxiety, and exercising ar linked to an enhancement of sympathetic tone. On the other hand, vagal tone is increased during the course of relaxing situations. In average people, both the sympathetic and the parasympathetic tone varies all over the day [7]. HRV indicator like the ra frequency to high frequency power was used for describing sympathovagal harmony. In the lack of sympathetic and parasympathetic feedback to sinus node, sinus node shoots at the intrinsic rate or simply R-R interval. Whenever vagal effect dominat heartrate is lower than intrinsic heart rate; whenever sympathetic effect dominate, heart rate is higher than intrinsic heart rate [4]. It was discovered that the HRV reduces along with age and with an individual, HRV is optimum during the course o centered i.e. HRV is increased at reduced heart rates [8]. Several scientific studies have confirmed variations in HRV factors in disease situations. [9 explanation of this is that the particular disease condition either causes, is caused by or is linked with irregularities of cardiac autonomic regulation. The diseased situation is connected with inherent mental pressure, not due to the pathological course of action of the disorder, but merely by stress and anxiety invoked in individuals as a consequence of consciousness of the disease or disorder. Anxiety induced fatigue is found to provoke the behavioral alerting consequence in human beings, that will be alerting consequence in human beings, that will be The objective of this particular research was the analysis of variations in the heart rate variability indicating the functionality of the autonomic nervous system as well as psychotic strain because of learning classroom study in the students. Comprehensive records were obtained from 25 students before and after the computer-based e- learning classroom study for 2 hours having an average age of 21 years and in accordance with two HRV measurements of each student. The frequency domain and nonlinear analysis of HRV were conducted using the non-parametric FFT spectrum and Poincare plot analysis receptively on RR time series data extracted from ECG recordings. The HRV factors and details disclosed considerable variations in HRV before and after learning classroom study in determining the autonomic status, HRV has emerged to be an ordinary technique to assess the athovagal equilibrium at sinoatrial level [6]. The sinus node is controlled by both parasympathetic (vagal) and sympathetic influences. Its well-accepted that situations such as for instance presuming an upright placement, mental anxiety, and exercising are linked to an enhancement of sympathetic tone. On the other hand, vagal tone is increased during the course of relaxing situations. In average people, both the sympathetic and the parasympathetic tone varies all over the day [7]. HRV indicator like the ratio of low- frequency to high frequency power was used for describing sympathovagal harmony. In the lack of sympathetic and parasympathetic feedback to sinus node, sinus node shoots at the intrinsic rate or simply R interval. Whenever vagal effect dominates, the heartrate is lower than intrinsic heart rate; whenever sympathetic effect dominate, heart rate is higher than intrinsic heart rate [4]. It was discovered that the HRV reduces along with age and with an individual, HRV is optimum during the course of sleep. It's also rate centered i.e. HRV is increased at reduced heart rates learning, FFT past two generations have experienced the identification of an important connection in between the autonomic nervous cardiovascular fatality, consisting of unexpected 4]. Experimental confirmation for h a tendency for venomous arrhythmias to symptoms sympathetic or minimal vagal function has inspired the evolution of quantitative indicators of the autonomic function. Heart rate variability (HRV) stands among the most encouraging such indicators. The seemingly simple derivation of this particular measurement has prominent its application. Among system system (ANS) (ANS) and and Several scientific studies have confirmed variations in HRV factors in disease situations. [9–11] The explanation of this is that the particular disease uses, is caused by or is linked with irregularities of cardiac autonomic regulation. The diseased situation is connected with inherent mental pressure, not due to the pathological course of action of the disorder, but merely by stress and anxiety n individuals as a consequence of consciousness of the disease or disorder. Anxiety induced fatigue is found to provoke the behavioral of of either either greater greater @ IJTSRD | Available Online @ www.ijtsrd.com www.ijtsrd.com | Volume – 2 | Issue – 6 | Sep-Oct 2018 Oct 2018 Page: 916
International Journal of Trend in Scientific Research and Development (IJTSRD International Journal of Trend in Scientific Research and Development (IJTSRD) ISSN: 2456 ) ISSN: 2456-6470 pertaining to boost in sympathetic activities and a drop in parasympathetic cardiovascular system. [12] This particular alternation in cardiac autonomic function alone could influence the HRV standards in patients. The time period of academic examination is a recognized model of mental pressure in scholars, overall performance in exams can determine their precious future potential. Various scientific studies state alterations in markers of anxiety in students throughout the period of examinations [13–15]. To examine the irregularities in HRV due to computer based e-learning that is caused by student’s brain functional as well as phycho-emotional state after attending class, for this 25 students in the age group of 18 to 24 years old were analyzed before and after the regular computer based e-learning classes. II. Materials and Tools A.Subjects Twenty-five students of single classroom age group of 18-24 (15 males and 10 female) volunteered to the part of this research were examined. A sample of time period 8.46 minute ECG data was recorded of each student before attending the e-learning class and after the continuous computer based e-learning class of basic computer knowledge of two hours. Each ECG recording of the particular student was taken on the same day in taking account of the timing and location. All the students were non-smoker, non healthy and none of the student’s family member was diabetic. B.Protocol All the recording was taken in the simple computer lab without any external interference like sound and scene. Subjects were stationary during the and sitting on the stools for 10 minutes. Subjects were instructed to do not change in their breathing unnecessary and to breath spontaneously in their regular rhythm. As a part of the study all the students were instructed to have only normal breakfast before attending the regular classes. Timing of the recording of all the students was in the morning between 7 am to 11 am. C.Tools ECG data was recorded by the 3 lead ECG hardware having double stage amplification and interfaced with laptop by the use of Arduino Uno for real time data acquisition with the help of LabVIEW software installed in the laptop. LabVIEW recorded the real installed in the laptop. LabVIEW recorded the real pertaining to boost in sympathetic activities and a hetic cardiovascular system. [12] This particular alternation in cardiac autonomic function alone could influence the HRV standards in patients. The time period of academic examination is a recognized model of time ECG signal in laptop in dot tdms file format at the sampling frequency of 500hz. This sampled data was processed by the ECG feature extractor in Biomedical Workbench of NI for signal processing and feature extraction and RR time interval was extracted in a .txt file which can be analyzed by the HRV analysis software. Heart rate variability analyzer in Biomedical workbench is used for HRV analysis which took data directly from the ECG feature extractor after the signal processing. HRV analyzer having the Poincare plot and FFT spectrum method of HRV analysis which generates values of HRV indices with different color coding [16]. As numerous commercial products nowadays furnish automated statistic of HRV measurement, the heart specialist has been presented that has seemingly easy tool both for research as well as clinical tests [5]. III. Methods of analysis A.Spectral Analysis There are multiple frequencies or frequency bands in the HRV analysis. Since 1960s there are various spectral analysis techniques have been e analysis of tachogram [17]. The important and basic information about the how power is dispersing in terms of frequencies; is generated by the power spectral density analysis of the RR time interval series by applying appropriate mathematica There are to techniques are presented to calculated the PSD of the signal; first one is parametric method and second one is non-parametric method, these both techniques uses the different mathematical algorithms for computation. In this prese non-parametric method is employed with the help of software as you can see a generated FFT spectrum of one subject in the figure (1). There are main three spectral components are recognized within the spectrum computed from RR time in recording after applying FFT based algorithm [18,19,20,21,24]: The first spectral component is very low frequency (VLF) (0.003 to 0.04 Hz), Second spectral component is low frequency (LF) (0.04 to 0.15Hz), and the third spectral component is frequency (HF) (0.15 to 0.4 Hz). The powers and fundamental frequency of all the frequency bands varies in accordance with the fluctuations in heart rhythms [21,22,23]. Dimension of power elements within VLF, LF and also HF bands is the absolute values of the power (ms2), although LF as well as HF can be calculated in normalized units (n.u.) [21,22]. can be calculated in normalized units (n.u.) [21,22]. ECG signal in laptop in dot tdms file format at the sampling frequency of 500hz. This sampled data was processed by the ECG feature extractor in Biomedical Workbench of NI for signal processing and feature extraction and RR time interval was a .txt file which can be analyzed by the HRV analysis software. Heart rate variability analyzer in Biomedical workbench is used for HRV analysis which took data directly from the ECG feature extractor after the signal processing. HRV analyzer incare plot and FFT spectrum method of HRV analysis which generates values of HRV indices with different color coding [16]. As numerous commercial products nowadays furnish automated statistic of HRV measurement, the heart specialist has t has seemingly easy tool both for research as well as clinical tests [5]. activities activities in in the the overall performance in exams can determine their precious future potential. Various scientific studies state alterations in markers of anxiety in students throughout the period of 15]. To examine the irregularities learning that is caused by student’s brain functional as well as emotional state after attending class, for this 25 students in the age group of 18 to 24 years old were analyzed before and after the regular computer five students of single classroom age group of 24 (15 males and 10 female) volunteered to the part of this research were examined. A sample of time period 8.46 minute ECG data was recorded of each There are multiple frequencies or frequency bands in the HRV analysis. Since 1960s there are various spectral analysis techniques have been evolved for the analysis of tachogram [17]. The important and basic information about the how power is dispersing in terms of frequencies; is generated by the power spectral density analysis of the RR time interval series by applying appropriate mathematical algorithms. There are to techniques are presented to calculated the PSD of the signal; first one is parametric method and parametric method, these both techniques uses the different mathematical algorithms for computation. In this presented paper, FFT based parametric method is employed with the help of software as you can see a generated FFT spectrum of one subject in the figure (1). There are main three spectral components are recognized within the spectrum computed from RR time interval series recording after applying FFT based algorithm [18,19,20,21,24]: The first spectral component is very low frequency (VLF) (0.003 to 0.04 Hz), Second spectral component is low frequency (LF) (0.04 to 0.15Hz), and the third spectral component is high frequency (HF) (0.15 to 0.4 Hz). The powers and fundamental frequency of all the frequency bands varies in accordance with the fluctuations in heart rhythms [21,22,23]. Dimension of power elements within VLF, LF and also HF bands is the absolute s of the power (ms2), although LF as well as HF learning class and after learning class of basic computer knowledge of two hours. Each ECG recording of the particular student was taken on the same day in taking account of the timing and location. smoker, non-alcoholic, healthy and none of the student’s family member was All the recording was taken in the simple computer lab without any external interference like sound and scene. Subjects were stationary during the recording and sitting on the stools for 10 minutes. Subjects were instructed to do not change in their breathing unnecessary and to breath spontaneously in their regular rhythm. As a part of the study all the students reakfast before attending the regular classes. Timing of the recording of all the students was in the morning between 7 am ECG data was recorded by the 3 lead ECG hardware having double stage amplification and interfaced with laptop by the use of Arduino Uno for real time data acquisition with the help of LabVIEW software @ IJTSRD | Available Online @ www.ijtsrd.com www.ijtsrd.com | Volume – 2 | Issue – 6 | Sep-Oct 2018 Oct 2018 Page: 917
International Journal of Trend in Scientific Research and Development (IJTSRD International Journal of Trend in Scientific Research and Development (IJTSRD) ISSN: 2456 ) ISSN: 2456-6470 descriptors SD1 and SD2 with references to linear tatistics, provided by Brennan et al [31] demonstrates that the typical descriptors assist the visual evaluation of the entire distribution. This exhibits an alluring pattern of the RR time interval data by portraying both the short as well as long term variations in the ECG signal [30, 31]. SD1 reveals standard deviation of short term HRV in the data. The SD2 reveals standard deviation of progressive long term RR time intervals (major axis of ellipse) is determined with horizontal axis. SD1 signifies the instantaneous beat- beat HRV and SD2 signifies the continual beat to beat HRV [32,33,34]. And the ratio of SD1/SD2 signifies randomness in heart rate variability (HRV) [35]. The location at which both axes contrast, represents total mean of RR time intervals. Several experts demonstrated that varying lags associated with Poincare plot. However, this will render better comprehension regarding the autonomic regulation of heart rate [27, 36]. After processing the recorded EGG data of students Poincare analysis was done by the use of HRV analyzer for each student record. A sample Poincare and its descriptors are show below for 8.46 descriptors SD1 and SD2 with references to linear statistics, provided by Brennan et al [31] demonstrates that the typical descriptors assist the visual evaluation of the entire distribution. This exhibits an alluring pattern of the RR time interval data by portraying both the short as well as long term va ECG signal [30, 31]. SD1 reveals standard deviation of short term HRV in the data. The SD2 reveals standard deviation of progressive long term RR time intervals (major axis of ellipse) is determined with horizontal axis. SD1 signifies the i to-beat HRV and SD2 signifies the continual beat to beat HRV [32,33,34]. And the ratio of SD1/SD2 signifies randomness in heart rate variability (HRV) [35]. The location at which both axes contrast, represents total mean of RR time interv experts demonstrated that varying lags associated with Poincare plot. However, this will render better comprehension regarding the autonomic regulation of heart rate [27, 36]. After processing the recorded EGG data of students Poincare analysi of HRV analyzer for each student record. A sample Poincare and its descriptors are show below for 8.46 minute ECG recording. Fig. 1. HRV spectrum of sample data of one subject generated by HRV analyzer, where Green indicates the VLF spectrum, Blue indicates the LF and Red indicates the HF spectrum. indicates the HF spectrum. Fig. 1. HRV spectrum of sample data of one subject generated by HRV analyzer, where Green indicates the VLF spectrum, Blue indicates the LF and Red Based on the above RR-interval power spectrum Index of Centralization (IC) indicator is calculated which is associated with the brain’s functional and phycho-emotional stress. IC=((VLF+LF))/HF (1) where VLF, LF and HF are the Power spectral density in the respective frequency band. Increasing IC indicates the rise in heart rhythm [37, 38]. B.Poincare Plot Analysis The Poincare plot as part of HRV is actually a scatter plot belonging to current R-R time interval plotted versus the prior R-R time interval. The Poincare plot can also abbreviate as Lorenz plot, scatter gram or Scatter plot and phase delay map or Return map. Poincare plot study is a simplified quantitative graphic approach in comparison to typical fast Fourier transform (FFT) exponent [27, 28]. The plot caters summary reports along with comprehensive beat beat insight in regards to actions of the cardiovascular system (11). In this ellipse, points which are above the line are showing the intervals which are longer than preceding intervals and contrary points below the line showing intervals which are smaller the preceding interval. Hence, the dispersal of point’s vertical towards distinctive line of identity (width) exhibits the measure of interim HRV. The spots along with the distinctive line of identity (length) exhibit the long term HRV [29]. Tulppo et al [30] equipped an ellipse in the form of the Poincare plot and also stated two typical descriptors of the entire plot, SD1 and then SD2, just for quantification of the entire geometry. Such standard descriptors portray the minor axis as well as the major axis on the ellipse correspondingly as displayed in Figure 2. The explanation of as displayed in Figure 2. The explanation of interval power spectrum Index of Centralization (IC) indicator is calculated which is associated with the brain’s functional and IC=((VLF+LF))/HF (1) here VLF, LF and HF are the Power spectral density in the respective frequency band. Increasing IC 37, 38]. The Poincare plot as part of HRV is actually a scatter time interval plotted R time interval. The Poincare plot can also abbreviate as Lorenz plot, scatter gram or Scatter plot and phase delay map or Return map. Poincare plot study is a simplified quantitative to typical fast Fourier transform (FFT) exponent [27, 28]. The plot caters summary reports along with comprehensive beat-to- beat insight in regards to actions of the cardiovascular system (11). In this ellipse, points which are above the he intervals which are longer than preceding intervals and contrary points below the line showing intervals which are smaller the preceding Fig. 2. Generated Poincare plot and values of SD1=16 and SD2=45 for 8.46 minute ECG data by Biomedical Workbench’s HRV analyzer, where green and bluish line depicts the SD1 and SD2 respectively. IV. Results From the above tools and methods Non parametric FFT spectrum as frequency domain analysis is done for 25 students and power of frequency bands were calculated which are shown in the Table 1. Where we can see the variations in the values of VLF, LF, HF and IC for before and after computer based e classroom study. Fig. 2. Generated Poincare plot and values of SD1=16 and SD2=45 for 8.46 minute ECG data by Biomedical rkbench’s HRV analyzer, where green and bluish line depicts the SD1 and SD2 respectively. Hence, the dispersal of point’s vertical towards distinctive line of identity (width) exhibits the e of interim HRV. The spots along with the distinctive line of identity (length) exhibit the long- term HRV [29]. Tulppo et al [30] equipped an ellipse in the form of the Poincare plot and also stated two typical descriptors of the entire plot, SD1 and then SD2, just for quantification of the entire geometry. Such standard descriptors portray the minor axis as well as the major axis on the ellipse correspondingly From the above tools and methods Non parametric FFT spectrum as frequency domain analysis is done for 25 students and power of frequency bands were calculated which are shown in the Table 1. Where we can see the variations in the values of VLF, LF, HF and IC for before and after computer based e-learning @ IJTSRD | Available Online @ www.ijtsrd.com www.ijtsrd.com | Volume – 2 | Issue – 6 | Sep-Oct 2018 Oct 2018 Page: 918
International Journal of Trend in Scientific Research and Development (IJTSRD) ISSN: 2456 International Journal of Trend in Scientific Research and Development (IJTSRD) ISSN: 2456 International Journal of Trend in Scientific Research and Development (IJTSRD) ISSN: 2456-6470 Table 1 Values of Power Spectrum Bands and Index o Before e-learning study VLF Power LF Power 250 730 110 280 19 250 72 420 230 510 110 340 44 360 150 450 390 770 24 31 47 740 320 870 130 1200 77 320 23 160 140 290 130 450 8.6 28 20 620 140 540 42 250 54 280 22 160 100 570 260 550 Values of Power Spectrum Bands and Index of Centralization learning study HF Power IC1 825 1.187 284 1.373 384 0.700 93 5.290 213 3.474 424 1.061 71.2 5.674 241 2.489 227 5.110 20.3 2.709 290 2.713 617 1.928 1010 1.316 691 0.574 168 1.089 214 2.009 881 0.658 9.76 3.75 199 3.216 91.4 7.439 63.9 4.569 101 3.306 84.6 2.151 1140 0.587 299 2.709 Using same tools Poincare plot analysis is done and values of SD1, SD2 and ratio the SD1/SD2 calculated for both time recording before attending the e-learning class and just after the e study without any other interference or activity in between and these Poincare plot descriptors for both are shown in Table 2. Which clearly s variation in the ratio SD1/SD2. We can easily observe the difference, there is the decrement in the magnitude of ratio SD1/SD2 after the computer classes. f Centralization After e-learning study learning study Subject VLF Power LF Power 480 140 81 390 150 110 570 350 52 21 22 730 130 120 15 49 35 47 100 170 66 44 12 150 140 HF Power 395 225 141 171 260 169 147 183 33.8 15 93.9 673 316 221 14.7 57.6 114 23.5 79.8 39.7 47.5 50.3 62.6 709 133 IC2 5.265 2.577 5.184 7.543 4.807 2.899 9.251 4.972 7.455 4.2 3.748 2.228 2.531 3.981 3.945 6.753 1.535 7.531 5.639 12.846 6.442 3.658 2.587 0.860 5.939 1 2 3 4 5 6 7 8 9 10 11 12 13 14 15 16 17 18 19 20 21 22 23 24 25 1600 440 650 900 1100 380 790 560 200 42 330 770 670 760 43 340 140 130 350 340 240 140 150 460 650 A comparison graph can be plotted form above statistical data shown in Table 1 for values of IC for both before and after attending e-learning class of each student. The graph is shown in Fig. 3 which clearly showing the increment in the IC values of every student. A comparison graph can be plotted form above statistical data shown in Table 1 for values of IC for Using same tools Poincare plot analysis is done and values of SD1, SD2 and ratio the SD1/SD2 are calculated for both time recording before attending learning class and just after the e-learning class study without any other interference or activity in between and these Poincare plot descriptors for both are shown in Table 2. Which clearly shows the variation in the ratio SD1/SD2. We can easily observe the difference, there is the decrement in the magnitude of ratio SD1/SD2 after the computer-based e-learning learning class of each student. The graph is shown in Fig. 3 which clearly showing the increment in the IC values of Fig. 3. Comparison graph for each student where IC1 is the value of IC before attending e-learning class and IC2, after attending e-learning class. Fig. 3. Comparison graph for each student where IC1 learning class learning class. @ IJTSRD | Available Online @ www.ijtsrd.com www.ijtsrd.com | Volume – 2 | Issue – 6 | Sep-Oct 2018 Oct 2018 Page: 919
International Journal of Trend in Scientific Research and Development (IJTSRD) ISSN: 2456 International Journal of Trend in Scientific Research and Development (IJTSRD) ISSN: 2456 International Journal of Trend in Scientific Research and Development (IJTSRD) ISSN: 2456-6470 Table 2 Values of Descriptors Sd1 SubjectBefore e SD1 1 47 2 26 3 25 4 13 5 27 6 33 7 16 8 20 9 18 10 17 11 16 12 36 13 34 14 28 15 19 16 25 17 59 18 7.8 19 15 20 18 21 10 22 12 23 12 24 33 25 33 Values of Descriptors Sd1 and Sd2 and their Ratio Before e-learning study After e-learning study SD1 SD2 SD1/SD2 SD1 SD2 SD1/SD2 78 0.602 51 0.509 36 0.694 41 0.317 62 0.435 61 0.540 45 0.355 50 0.4 54 0.333 39 0.435 49 0.326 74 0.486 62 0.548 61 0.459 37 0.513 53 0.471 87 0.678 21 0.371 41 0.365 52 0.346 38 0.263 42 0.285 30 0.4 62 0.403 70 0.471 V. In the frequency domain analysis, the computation of index of centralization (IC) parameter by the use of VLF, LF and HF for both the times, before and the after PC interactive e-learning study of each student, demonstrates the brain’s functional as well as phycho emotional state. Which means increment in the IC indicating the increment in the central control of the student’s heart rhythm. [37, 38] From the Table 1, we can see that the value of IC of each student is incremented after the computer classroom study as compare to prior to attend the e learning class. Which indicates that computer e-learning causes the increment in the phycho emotional stress as well as brains functionally of each student that affects the heart rate variability. In the Poincare plot analysis, descriptor SD1/SD2 ratio is used as a key parameter for analyzing the results. As previous studies show that the ratio SD1/SD2 is lower for unhealthy persons which shows the more regular rhythm [39 25 17 15 15 23 21 17 19 13 7 9.1 37 28 20 7.5 12 19 5.7 11 8.1 8.6 9.2 11 25 18 91 44 50 52 57 47 59 67 57 20 37 85 53 55 22 44 43 25 41 43 40 33 32 65 52 0.274 0.386 0.3 0.241 0.403 0.446 0.288 0.283 0.228 0.35 0.245 0.435 0.528 0.363 0.340 0.272 0.441 0.228 0.268 0.188 0.215 0.278 0.343 0.384 0.346 Based on the data generated in Table 2, A comparison graph can be plotted for each student’s SD1/SD2 ratio for both times before and after the attending e learning class, shown in figure (4) which depicts the increment in the ratio of SD1/SD2 for each student. Fig. 4. Comparison graph of each student where R1 is value of ratio SD1/SD2 before attending e class and R2, after attending the e-learning Based on the data generated in Table 2, A comparison graph can be plotted for each student’s SD1/SD2 ratio for both times before and after the attending e- Discussion In the frequency domain analysis, the computation of index of centralization (IC) parameter by the use of VLF, LF and HF for both the times, before and the learning study of each student, functional as well as phycho- emotional state. Which means increment in the IC indicating the increment in the central control of the student’s heart rhythm. [37, 38] From the Table 1, we can see that the value of IC of each student is computer-based e-learning classroom study as compare to prior to attend the e- learning class. Which indicates that computer-based learning causes the increment in the phycho- emotional stress as well as brains functionally of each e heart rate variability. (4) which depicts the increment in the ratio of SD1/SD2 for each student. Fig. 4. Comparison graph of each student where R1 is value of ratio SD1/SD2 before attending e-learning In the Poincare plot analysis, descriptor SD1/SD2 ratio is used as a key parameter for analyzing the results. As previous studies show that the ratio SD1/SD2 is lower for unhealthy persons which shows learning class. [39, 40]. And in this @ IJTSRD | Available Online @ www.ijtsrd.com www.ijtsrd.com | Volume – 2 | Issue – 6 | Sep-Oct 2018 Oct 2018 Page: 920
International Journal of Trend in Scientific Research and Development (IJTSRD International Journal of Trend in Scientific Research and Development (IJTSRD) ISSN: 2456 ) ISSN: 2456-6470 presented study on 25 students, we noticed decrement in the ratio SD1/SD2 after the e-learning classroom study, from which can refer that with the computer based e-learning having the adverse effect on the cardiovascular system. VI. Conclusion Based on the research work done in this paper on this HRV analysis using two methods of analysis; both spectral analysis and Poincare plot analysis, this can be concluded that PC interactive e-learning studies causes the increment in the HRV which is in the brain’s functional as well as phycho state of students. There could be numerous other factors can be involved that need further study on the same topic to identify other possible outcomes so that more precise and accurate result can based on the HRV analysis. ACKNOWLEDGMENT I would like to thanks to all the volunteer who gave their valuable time and support for particular research work. REFERENCES 1.Lown B, Verrier R L. Neural activity and ventricular fibrillation. N Engl J Med 1976; 294: 1165–70. presented study on 25 students, we noticed decrement autonomic autonomic Wkly,134, 2004, pp. 514–522. nervous nervous system”, system”, 522. Swiss Med learning classroom study, from which can refer that with the computer- learning having the adverse effect on the 7.Jeffrey J. Goldberger, “Sympathovagal balance: how should we measure it?” (Heart Circ. Physiol. 4), 1999, pp. H1273 . 4), 1999, pp. H1273- H1280. Jeffrey J. Goldberger, “Sympathovagal balance: how should we measure it?” Am. J. Physiol. 276 8.Awdah Al-Hazimi, Nabil Al Syiamic, ReemQosti, and Khidir Abdel “Time domain analysis of heart rate variability in diabetic patients with and without autonomic neuropathy,” Annals ofSaudi Medicine, 22 2002, pp. 400-402. Hazimi, Nabil Al-Ama, Ahmad Syiamic, ReemQosti, and Khidir Abdel-Galil, omain analysis of heart rate variability in diabetic patients with and without autonomic Annals ofSaudi Medicine, 22 (5-6), Based on the research work done in this paper on this HRV analysis using two methods of analysis; both spectral analysis and Poincare plot analysis, this can learning studies causes the increment in the HRV which is induced by the brain’s functional as well as phycho-emotional state of students. There could be numerous other factors can be involved that need further study on the same topic to identify other possible outcomes so that more precise and accurate result can be predicted 9.Mittal C M, Wig N, Mishra S, Deepak K rate variability in human immunodeficiency virus positive individuals. Int J Cardiol Int J Cardiol2004;94:1–6. N, Mishra S, Deepak K K. Heart rate variability in human immunodeficiency virus- 10.Dobrek L, Nowakowski M, Mazur M, Herman R M, Thor P J. Disturbances of the parasympathetic branch of the autonomic nervous system in patients with gastro esophageal (GERD) estimated by short variability recordings. J PhysiolPharmacol 55 (Suppl 2):77–90. Dobrek L, Nowakowski M, Mazur M, Herman R J. Disturbances of the parasympathetic branch of the autonomic nervous system in tro esophageal reflux disease (GERD) estimated by short-term heart rate J PhysiolPharmacol2004; the volunteer students support for this 11.Chen J L, Chiu H W, Tseng Y Hyperthyroidism increased sympathetic and decreased modulation of heart rate: Evidence from spectral analysis of heart rate variability. (Oxf) 2006; 64:611–16. W, Tseng Y J, Chu W C. Hyperthyroidism increased sympathetic and decreased vagal modulation of heart rate: Evidence from spectral analysis of heart rate variability. ClinEndocrinol is is characterized characterized by by both both L. Neural activity and fibrillation. N Engl J Med 1976; 294: 2.Corr P B, Yamada K A, Witkowski F Mechanisms controlling function and their relation to arrhythmogenesis. In: Fozzard HA, Haber E, Jennings RB, Katz AN, Morgan HE, eds. The Heart and Cardi System. New York: Raven Press, 1986: 1343 1403. A, Witkowski F X. Mechanisms function and their relation to arrhythmogenesis. In: Fozzard HA, Haber E, Jennings RB, Katz AN, Morgan HE, eds. The Heart and Cardiovascular System. New York: Raven Press, 1986: 1343– controlling cardiac cardiac autonomic autonomic 12.Marshall J M. Cardiovascular changes associated with behavioural alerting. In: Jordan D, Marshall J (eds). Cardiovascular Portland Press; 1995:37–59. M. Cardiovascular changes associated with behavioural alerting. In: Jordan D, Marshall J Cardiovascular regu regulation. 59. London: 13.Takatsuji K, Sugimoto Y, Ishizaki S, Ozaki Y, Matsuyama E, Yamaguchi Y. The effects of examination stress immunoglobulin A, and chromogranin A in nursing students. Biomed Res Biomed Res 2008; 29:221–4. Takatsuji K, Sugimoto Y, Ishizaki S, Ozaki Y, Matsuyama E, Yamaguchi Y. The effects of stress immunoglobulin A, and chromogranin A in 3.Schwartz P J, Priori S G. Sympathetic nervous system and cardiac arrhythmias. In: Zipes D Jalife J, eds. Cardiac Electrophysiology. From Cell to Bedside. Philadelphia: W. 1990: 330–43. G. Sympathetic nervous on on salivary salivary cortisol, cortisol, system and cardiac arrhythmias. In: Zipes D P, Jalife J, eds. Cardiac Electrophysiology. From B. Saunders, 14.Johansson G G, Laakso M SL. Examination stress decreases plasma level of luteinizing hormone in male students. Med 1988; 50: 286–94. G, Laakso M L, Peder M, Karonen SL. Examination stress decreases plasma level of luteinizing hormone in male students. Psychosom 4.Levy M N, Schwartz P J eds. Vagal control of the heart: Experimental implications. Armonk: Future, 1994. implications. Armonk: Future, 1994. J eds. Vagal control of the heart: Experimental basis basis and and clinical clinical 15.Lucini D, Norbiato G, Clerici M, Pagani M. Hemodynamic and autonomic adjustments to real life stress conditions in humans. 2002; 39:184–8. Lucini D, Norbiato G, Clerici M, Pagani M. Hemodynamic and autonomic adjustments to real e stress conditions in humans. Hypertension 5.Dreifus L S, Agarwal J B, Botvinick E (American College of Cardiology Cardiovascular Technology Assessment Committe variability for risk stratification of life arrhythmias. J Am CollCardiol 1993; 22: 948 arrhythmias. J Am CollCardiol 1993; 22: 948–50. B, Botvinick E H et al. (American College of Cardiology Cardiovascular Technology Assessment Committee). Heart rate variability for risk stratification of life-threatening 16.Arjun Singh Vijoriya and Dr. Ranjan ECG Signal Acquisition, Feature Extraction and HRV Analysis Using Biomedical Workbench, International Journal of Advanced Research in International Journal of Advanced Research in Arjun Singh Vijoriya and Dr. Ranjan Maheshwari, ECG Signal Acquisition, Feature Extraction and HRV Analysis Using Biomedical Workbench, 6.J. Sztajzel, “Heart rate variability: a noninvasive electrocardiographic method to measure the electrocardiographic method to measure the J. Sztajzel, “Heart rate variability: a noninvasive @ IJTSRD | Available Online @ www.ijtsrd.com www.ijtsrd.com | Volume – 2 | Issue – 6 | Sep-Oct 2018 Oct 2018 Page: 921
International Journal of Trend in Scientific Research and Development (IJTSRD International Journal of Trend in Scientific Research and Development (IJTSRD) ISSN: 2456 ) ISSN: 2456-6470 Engineering and Technology, 9(3), 2018, pp 84 90. 9(3), 2018, pp 84– advanced heart failure. J Am CollCardiol 565– 569. J Am CollCardiol1994; 23: 17.Kay S M, Marple, S L. Spectrum analysis: A modern perspective Proc IEEE 1981; 69: 1380 1419. 30.Brennan M, Palaniswami M, Kamen P. Poincare plot interpretation using a physiological model of HRV based on a network of oscillators. JPhysiol Heart CircPhysiol H1886. L. Spectrum analysis: A Brennan M, Palaniswami M, Kamen P. Poincare plot interpretation using a physiological model of HRV based on a network of oscillators. Am Physiol Heart CircPhysiol2002; 283: H1873– modern perspective Proc IEEE 1981; 69: 1380– 18.Sayers B M. Analysis of heart rate variability. Ergonomics 1973; 16: 17–32. M. Analysis of heart rate variability. 31.Tulppo M P, Makikallio T Seppanen T, Huikuri H V. Quantitative beat beat analysis of heart rate dynamics during exercise. Am JPhysiol1996; 271: H244 1996; 271: H244–H252. P, Makikallio T H, Takala T E, V. Quantitative beat-to- beat analysis of heart rate dynamics during 19.Hirsh J A, Bishop B. Respiratory sinus arrhythmia in humans; how breathing pattern modulates heart rate. Am J Physiol 1981; 241: H620– A, Bishop B. Respiratory sinus arrhythmia n humans; how breathing pattern modulates heart –9. 20.Akselrod S, Gordon D, Ubel F A, Shannon D Barger A C, Cohen R J. Power spectrum analysis of heart rate fluctuation: a quantitative probe of beat to beat cardiovascular control. Science 1981; 213: 220–2. A, Shannon D C, 32.Brennan M, Palaniswami M, Kamen P. Do existing measures of Poincare plot geometry reflect nonlinear features of heart rate variability ? IEEE Trans Biomed Eng2001; 48: 1342 Brennan M, Palaniswami M, Kamen P. Do existing measures of Poincare plot geometry reflect nonlinear features of heart rate variability ? 2001; 48: 1342–1347. J. Power spectrum analysis of heart rate fluctuation: a quantitative probe of control. Science 1981; 33.Brennan, M., Palaniswami, M., &Kamen, P. (2001). Do existing measures of poin geometry reflect nonlinear features of heart rate variabil- ity. IEEE Transactions on Biomedical Engineering, 48, 10.1109/10.959330. Brennan, M., Palaniswami, M., &Kamen, P. (2001). Do existing measures of poincare plot geometry reflect nonlinear features of heart rate IEEE Transactions on Biomedical , 48, 21.Pagani M, Lombardi F, Guzzetti S spectral analysis of heart rate and arterial pressure variabilities as a marker of sympatho interaction in man and conscious dog. Circ Res 1986; 59: 178–93. Pagani M, Lombardi F, Guzzetti S et al. Power spectral analysis of heart rate and arterial pressure variabilities as a marker of sympatho-vagal interaction in man and conscious dog. Circ Res 1342 1342–1347. DOI: 22.Malliani A, Pagani M, Lombardi F, Cerutti S. Cardiovascular neural regulation explored in the frequency domain. Circulation 1991; 84: 1482 frequency domain. Circulation 1991; 84: 1482–92. Pagani M, Lombardi F, Cerutti S. Cardiovascular neural regulation explored in the 34.Kitlas, A., Oczeretko, E., Kowalewski, M., & Urban, M. (2004). Poincar´e plots in analysis of heart rate variability. PhysicaMedica 1), 76–79. Kitlas, A., Oczeretko, E., Kowalewski, M., & Urban, M. (2004). Poincar´e plots in analysis of PhysicaMedica, XX (Suppl. 23.Furlan R, Guzetti S, Crivellaro W Continuous 24-hour assessment of the neural regulation of systemic arterial pressur variabilities in ambulant subjects. Circulation 1990; 81: 537–47. Furlan R, Guzetti S, Crivellaro W et al. hour assessment of the neural 35.Piskorski, J., &Guzik, P. (2007). Geometry of Poincar´e plot of RR intervals and its asymmetry in healthy adults. Physiological Measurement 287–300. DOI: 10.1088/0967 300. DOI: 10.1088/0967-3334/28/3/005. Piskorski, J., &Guzik, P. (2007). Geometry of Poincar´e plot of RR intervals and its asymmetry Physiological Measurement, 28, pressure and RR variabilities in ambulant subjects. Circulation 24.Kobayashi M, Musha T. 1/f fluctuation of heart beat period. IEEE Trans Biomed Eng 1982; 29: 456–7. Kobayashi M, Musha T. 1/f fluctuation of heart beat period. IEEE Trans Biomed Eng 1982; 29: 36.Biala, T., Godge, M., Schlindwein, F. S., &Wailoo, M. (2010). Heart rate vari Poincar´e plots in 10 year old healthy and intrauterine growth restricted children with reference to maternal smoking habits during preg nancy. In Conference Proceeding: Com Cardiology, 26–29 September 2010 (pp. 971 974). Belfast, Ireland. Godge, M., Schlindwein, F. S., &Wailoo, M. (2010). Heart rate vari- ability using Poincar´e plots in 10 year old healthy and intrauterine growth restricted children with reference to maternal smoking habits during preg- nancy. In Conference Proceeding: Computingin 29 September 2010 (pp. 971– 25.Saul J P, Albrecht P, Berger R D, Cohen R Analysis of long term heart rate vari methods, 1/f scaling and implications. methods, 1/f scaling and implications. D, Cohen R J. Analysis of long term heart rate variability: 26.Computers in Cardiology 1987. IEEE Computer Society press, Washington 1988: 419 Society press, Washington 1988: 419–22. Computers in Cardiology 1987. IEEE Computer 37.Casolo G, Balli E, Taddei T, Amuhasi J, Gori C. Decreased spontaneous heart rate variability in congestive heart failure. Am J Cardiol 1162–1167 Casolo G, Balli E, Taddei T, Amuhasi J, Gori C. Decreased spontaneous heart rate variability in 27.Yamamoto Y, Hughson R L. Coarse spectral analysis: new method for studying heart rate variability. J Appl Physiol 1991; 71: 1143 L. Coarse-graining spectral analysis: new method for studying heart Am J Cardiol1989; 64: 991; 71: 1143–50. 28.Woo M A, Stevenson W G, Moser D RB, Harper RM. Patterns of beat-to- variability in advanced heart failure. 1992; 123: 704–710. G, Moser D K, Trelease -beat heart rate 38.Uskov, V., Lyamin, A., Lisi Smart e-learning biotechnical system. In: Vincenti, G., Bucciero, A., Vaz de Carvalho, C. (eds.) eLEOT 2014. LNICST, vol. 138, pp. 167 Heidelberg (2014) Uskov, V., Lyamin, A., Lisitsyna, L., Sekar, B.: learning biotechnical system. In: Vincenti, G., Bucciero, A., Vaz de Carvalho, C. (eds.) eLEOT 2014. LNICST, vol. 138, pp. 167–175. Springer, as as a a student student-centered variability in advanced heart failure. AmHeart J 29.Woo M A, Stevenson W G, Moser D Middlekauff H R. Complex heart rate var and serum norepinephrine levels in patients with and serum norepinephrine levels in patients with G, Moser D K, R. Complex heart rate variability @ IJTSRD | Available Online @ www.ijtsrd.com www.ijtsrd.com | Volume – 2 | Issue – 6 | Sep-Oct 2018 Oct 2018 Page: 922
International Journal of Trend in Scientific Research and Development (IJTSRD International Journal of Trend in Scientific Research and Development (IJTSRD) ISSN: 2456 ) ISSN: 2456-6470 39.Lisitsyna, L., Lyamin, A., Skshidlevsky, A.: Estimation of student functional state in learning management system by heart rate variability method. In: Neves-Silva, R., Tsihrintzis, G. Uskov, V., Howlett, R. J., Jain, L. C. (eds.) Smart Digital Futures 2014 - Frontiers in Artificial Intelligence and Applications, vol. 262, pp. 726 731. IOS Press (2014) Lisitsyna, L., Lyamin, A., Skshidlevsky, A.: Estimation of student functional state in learning management system by heart rate variability Silva, R., Tsihrintzis, G. A., C. (eds.) Smart Frontiers in Artificial and Applications, vol. 262, pp. 726– 40.Kitlas, A., Oczeretko, E., Kowalewski, M., & Urban, M. (2004). Poincar´e plots inmanalysis of heart rate variability. PhysicaMedica 1), 76–79. Kitlas, A., Oczeretko, E., Kowalewski, M., & Urban, M. (2004). Poincar´e plots inmanalysis of PhysicaMedica, XX (Suppl. 41.Faust, O., Acharya, U. R., Molinari, F., Chattopadhyay, S., & Tamura, T. (2012). Linear and non-linear analysis of cardiac health in diabetic subjects. Biomed-ical Signal Processing and Control, 7, 10.1016/j.bspc.2011.06.002. Faust, O., Acharya, U. R., Molinari, F., hattopadhyay, S., & Tamura, T. (2012). Linear linear analysis of cardiac health in ical Signal Processing 302. 295–302. DOI: DOI: @ IJTSRD | Available Online @ www.ijtsrd.com www.ijtsrd.com | Volume – 2 | Issue – 6 | Sep-Oct 2018 Oct 2018 Page: 923